If you watch any “tactical” shows about special operations (“SpecOps”) groups—whether military, government, or law enforcement—you have come across the use of jargon. In fact, the concept has bled over quite thoroughly into security operations (“SecOps”) as well. In this case, we’re talking about the request for a “SitRep,” or Situational Report. This is the equivalent of someone asking, “Hey, how are things going? Are you getting done what you’re supposed to get done? Are there any problems or issues we need to know about?”
Today’s call for a SitRep is all about your environment. Do you know what’s in it?
Start With the Fundamentals
The Center for Internet Security (CIS) has a list of the “Top 20” security controls, of which the first 5 deal almost exclusively with knowing your environment. Working through that, you’ll be asking yourself “What’s my SitRep?” many times. Knowing what is supposed to be in your environment, and what actually is in it, helps tremendously to improve overall security posture. From an incident response perspective, it also helps establish what is “normal”—and that enables you to identify “evil” much more effectively. And that reduces dwell time, improves the effectiveness of your response and remediation efforts, and reduces the cost of doing business (and for SecOps, that’s important).
The goal here is not to take a deep dive into the CIS Controls, nor try to reinvent the wheel. What we want to do is highlight some ways in which you may be able to leverage an EDR platform to help you along the way. In my experience working in InfoSec, it often seems that getting this type of data out of more obvious platforms proves to be more difficult than it should. As a result, I have used EDR with good success to help me—as an InfoSec practitioner—gain a better understanding of my environment. If I can do it, so can you!
What we will do is take a look at some simple ways you can leverage an EDR product for Controls 1, 2, 4, and 5. I’ll be using Carbon Black Response, but the concept applies to other EDR products as well. The goal is for you to start to see that there are ways to look at problems that may not fit into the “traditional” bucket, but are still beneficial and effective. If you are a Cb Response user, you will have some immediate tools to put into play.
Control 1: Inventory of Authorized and Unauthorized Devices
Typically, you’d expect to find information about active systems in Active Directory (AD), SCCM, or other enterprise management platforms, and it’s true that these are designed for that sort of thing. However, sometimes AD is a mess, SCCM agents don’t check in properly, or you don’t have the necessary access to such information. The adage of “trust but verify” can come into play as well, and I’ve often found EDR to be a better source of reliable information.
Granted, EDR cannot directly tell you about systems that it doesn’t have a sensor on. But the same is true—at least to an extent—with AD or other platforms. If endpoints aren’t communicating with the “mother ship,” then they’re unknown (and it’s also possible that they’re unauthorized). However, you can get an idea of authorized systems that are active on your network; you may also be able to infer from their network connections which other systems need to be included.
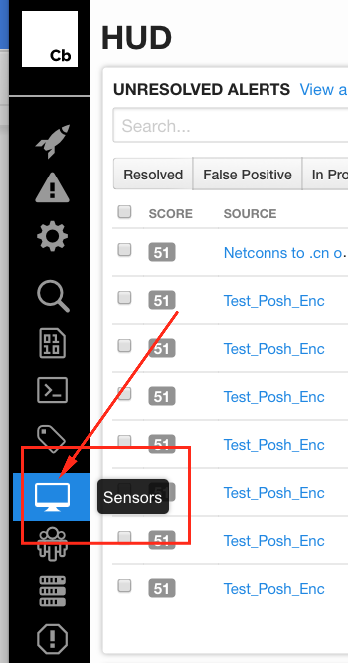
Once logged into Cb (at the default “HUD” dashboard), you’ll need to view your Sensors; there are a couple ways to get there.
- Browse down the icons on the left side, to the one for Sensors


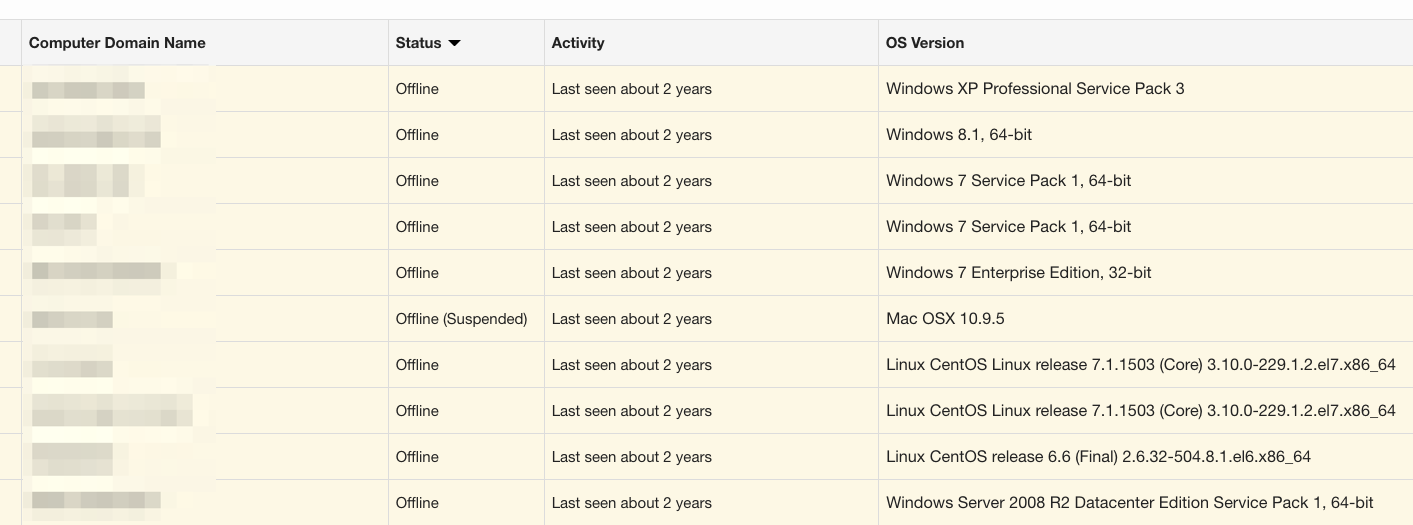
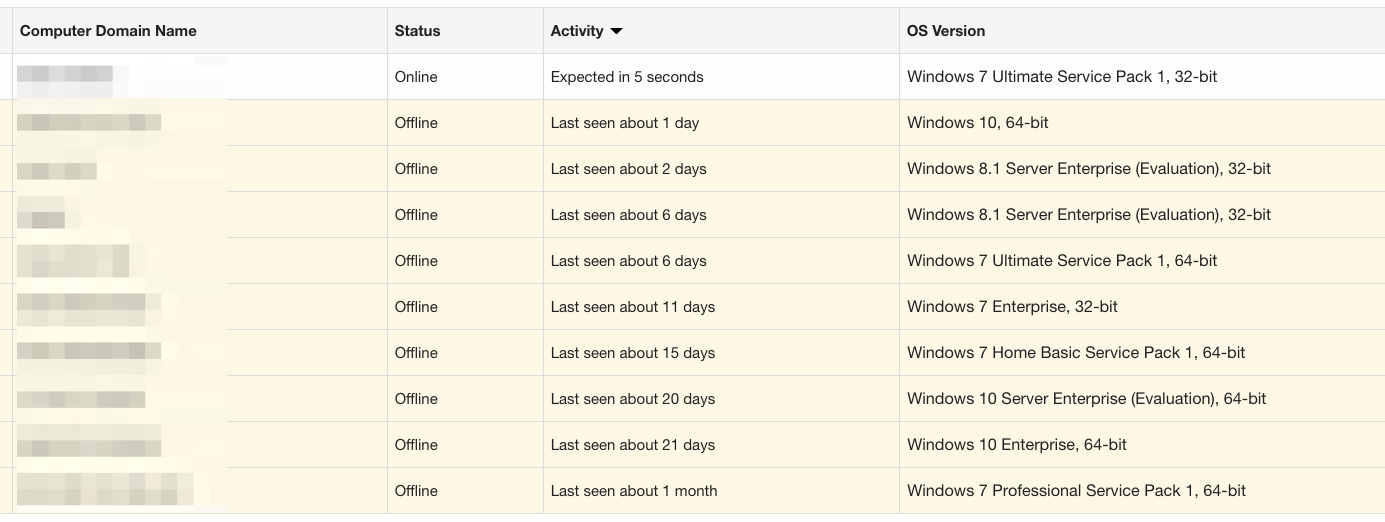
One of the easiest things to do in the GUI is see systems that may still be active, but haven’t checked in for some time; maybe they’re sitting in a desk drawer, have been decommissioned, died, or are at someone’s home. Simply sorting on Status helps us start to focus on potential inventory issues from that angle:
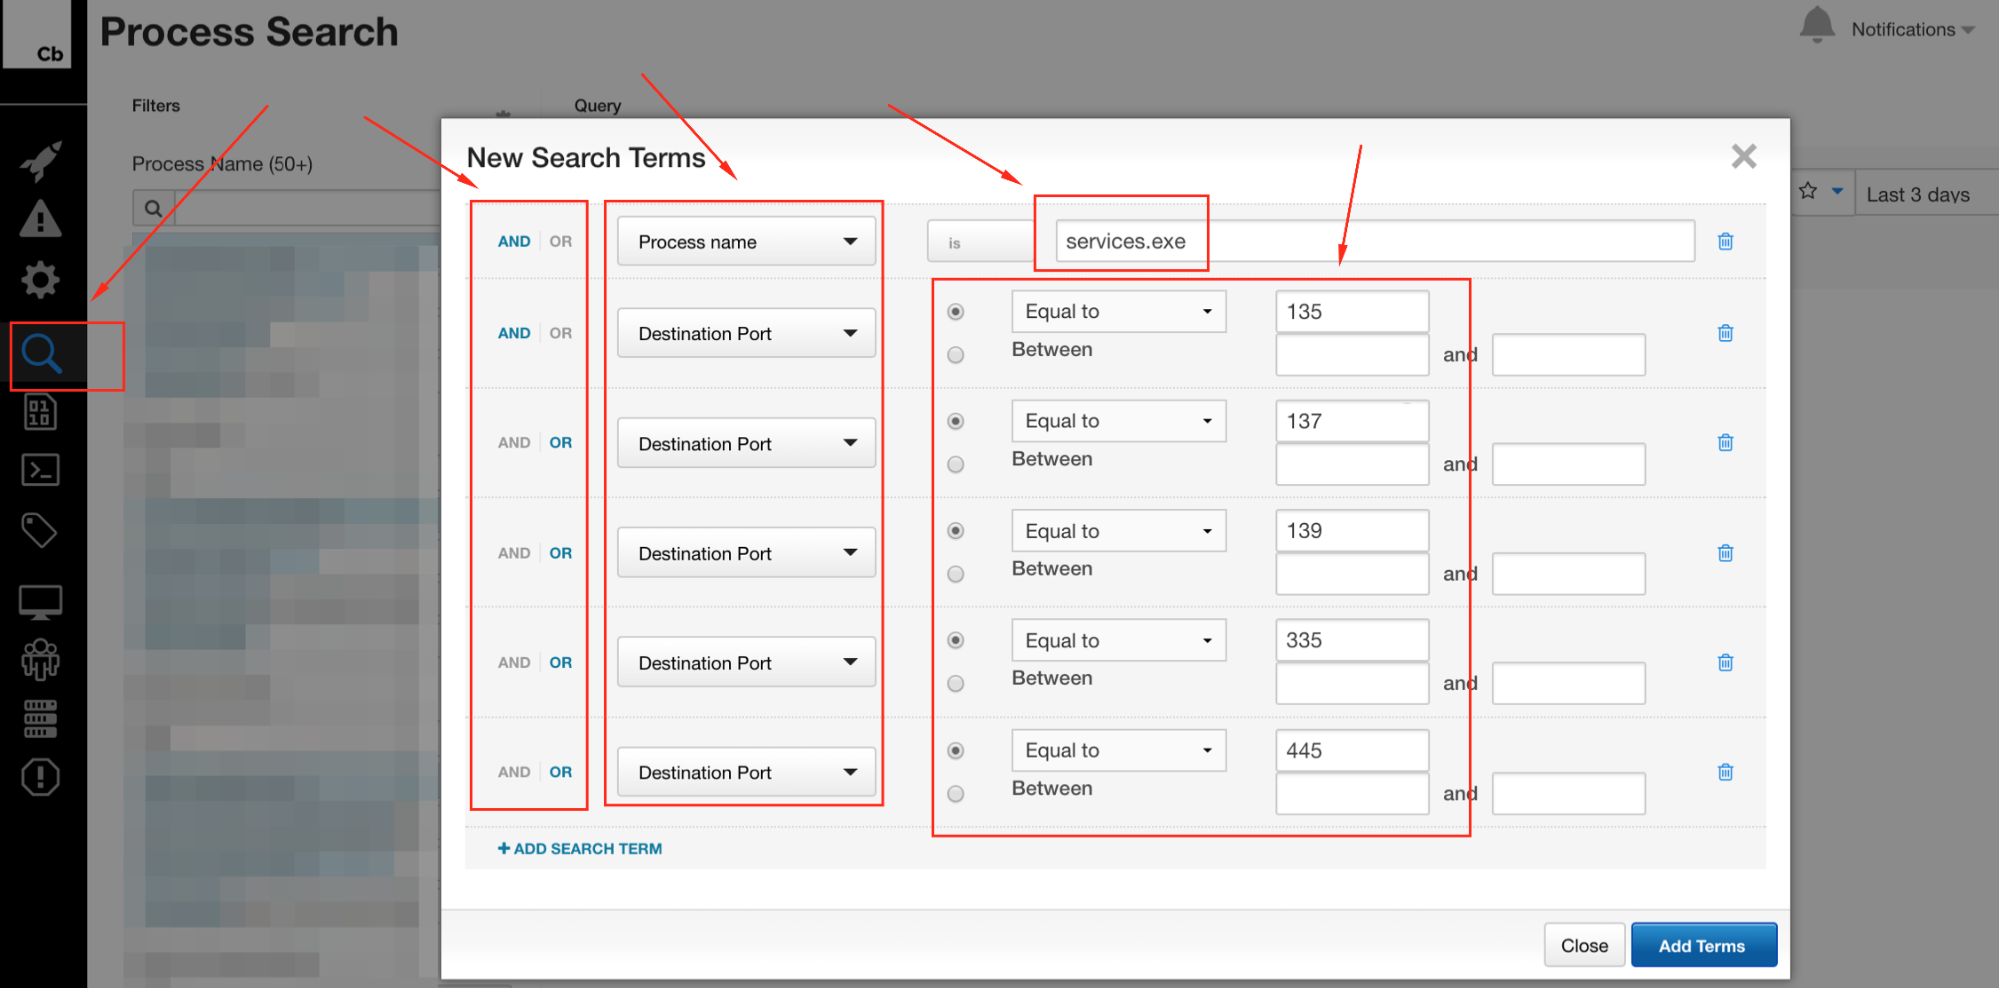

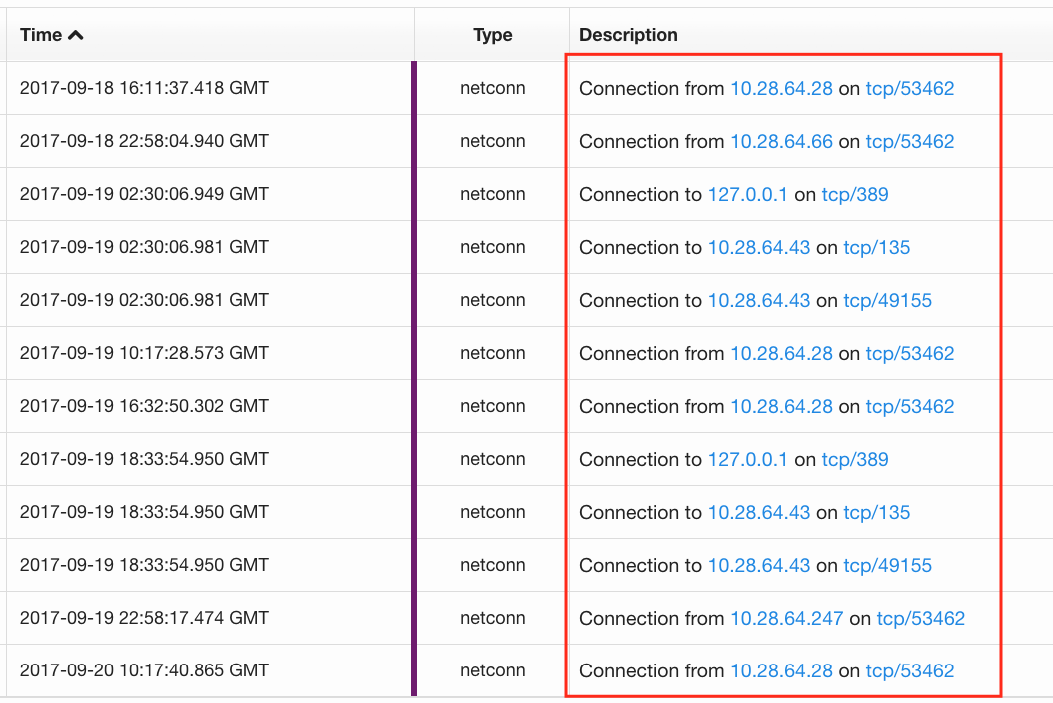
There are other ways to play this as well: Do you want to know about SMB traffic between hosts? Maybe query for explorer.exe and port 445. The possibilities are numerous, and efficacy may vary based on environment. As I said before, it’s largely a manual process, although scripting via the API is a definite option to help reduce the workload.
Control 2: Inventory of Authorized and Unauthorized Software
Okay, this is a fun one, and a particular pet peeve of mine—simply because as an analyst, this kind of stuff is extremely visible on a daily basis. If you don’t know what is running in your environment, you have little chance of identifying anomalies—and those often lead to attackers. This Control is all about making sure that only appropriate and approved software runs in your environment; naturally software inventory, distribution, management, and policy around approval come into play. We can’t address all those things with EDR, but we can help answer questions about what’s running.
To emphasize the importance of this in a very real-world way, I’m going to leverage two real example scenarios; both are supply-chain compromises. The first occurred late last year with the ASK Partner Network; you can read more about our initial detection in November and a second writeup by Cb. The second scenario was more recent, when it was announced that Piriform’s CCleaner had a compromised version.
Due to the fact that both of these are very commonplace—even in the enterprise—there was significant risk on a very broad scale. Putting on my “ranty” hat for a minute, this is why organizations should have solid software policies, processes for vetting and approvals, and systems to control usage. When those policies fail, you have to be able to identify what’s running that shouldn’t be (never mind why these would be desired in an enterprise in the first place). With that out of the way (whew, I feel better!), we’ll dive into using EDR to help with the last part.
Obviously EDR can be used tactically with IOCs like domains, IP addresses, and hash values, but those tend to be temporally limited and can miss details or lead to a false sense of security if no IOCs are found. Don’t get me wrong: that’s a great place to start, and it should help you start to scope out the extent of the threat. But where EDR starts to shine is by going beyond atomic and computed indicators, and strategically leveraging things that are more behavioral in nature.
The Cisco Talos post about the CCleaner compromise listed three hash values. Searching for those showed a common binary version of 5.33.00.6162. Pivoting on the binary metadata for version should start to expand the scope as we move away from purely tactical efforts; this will help identify binaries that may have originated from multiple sources (repackaged by distributors other than Piriform directly, for instance).
In Cb, a binary search for product and version can get us started on identifying impacted hosts, regardless of specific observed hash values. Note: these may be for installers, uninstallers, or any other application binary that meets the criteria. From there, you can start to identify related behaviors that may help you determine whether other processes are involved; for instance, common network connections, registry or file changes, code libraries, and so on. With each new piece of information uncovered, you have a “lather, rinse, repeat” scenario to refine your results. That puts you firmly in the behavioral realm, where you can start to identify previously unknown binaries based on the overall activity.
Control 4: Continuous Vulnerability Assessment and Remediation
Similar to the prior two Controls, there are systems designed specifically to address these types of issues. However, I recognize that for various reasons, those may not be present, or otherwise not give the desired level of visibility. (For instance, even if you’re doing vulnerability scanning, does the platform utilize credentials/agents in order to scan individual hosts, or is it solely network-based?) An EDR platform can also be used for quickly answering questions during the remediation process without having to schedule and perform a new vulnerability scan.
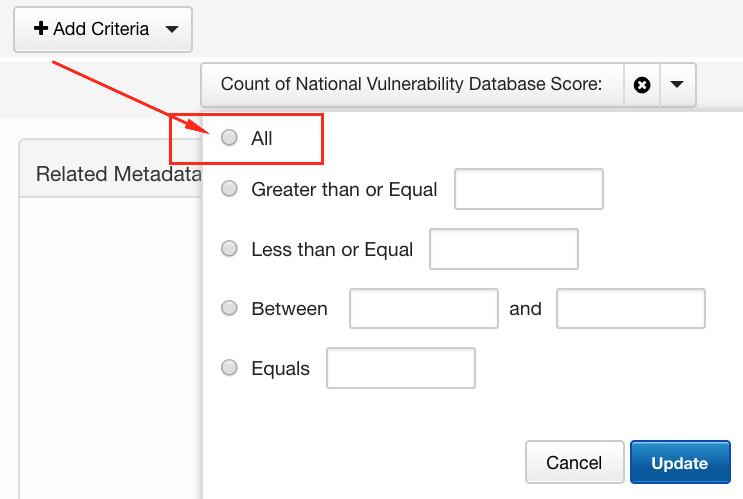
There is a Cb feed for the National Vulnerability Database that makes these types of things easier, and can be run from the binary search page. For instance, let’s say you were concerned about CVE-2017-3124 for Adobe Reader or needed to validate whether it had been properly patched.
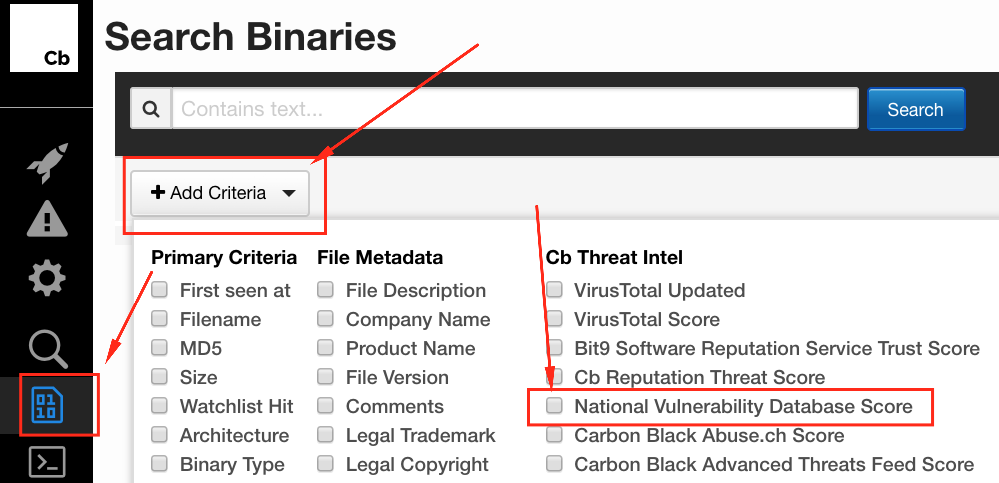
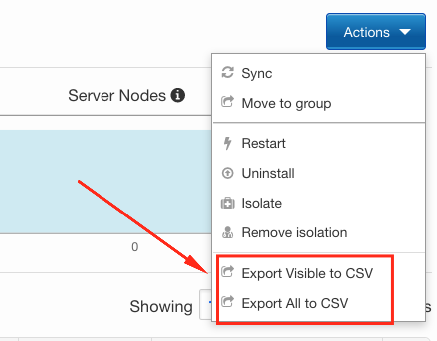
Those results can be sorted or filtered further, as well as exported to CSV for additional magic. More on how to do that coming up next.
However, you don’t have to rely solely on that feed (stuff happens, feeds get disabled or don’t work, and it’s always good to have a backup plan) – we can actually take a similar approach to the above in order to identify specific known vulnerable software. Looking for the same vulnerable software could go something like this:
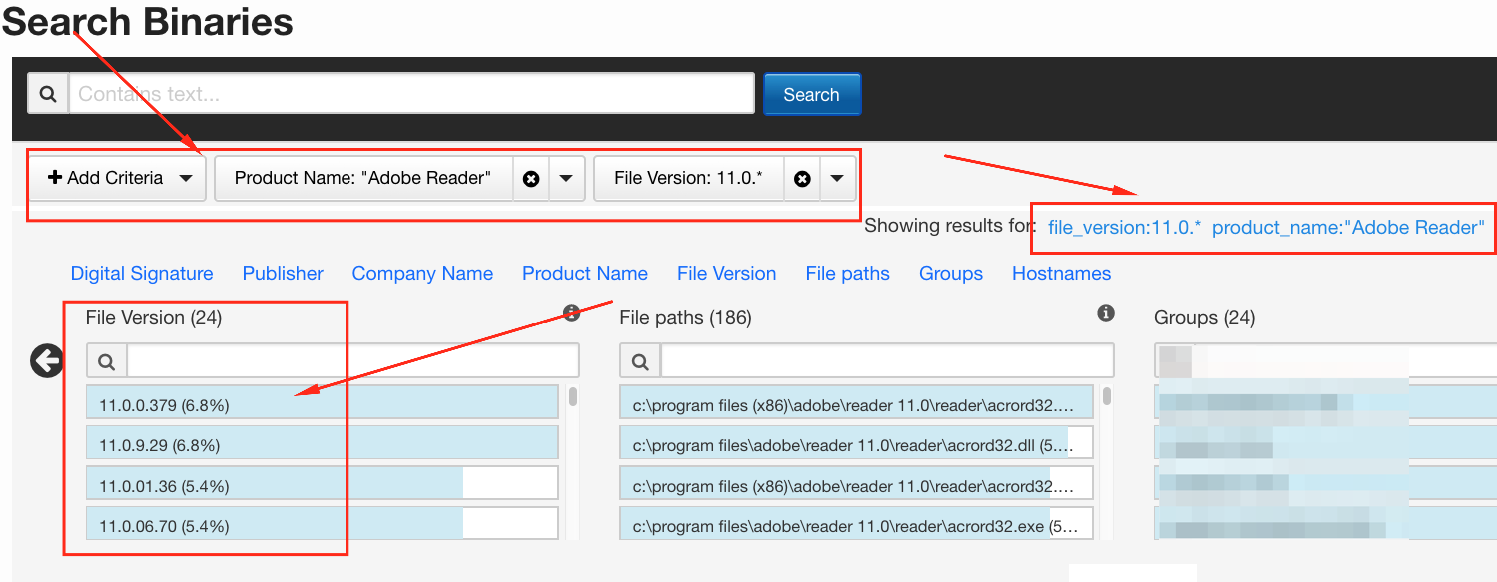
This process can be repeated for any versions prior to 11.0, simply by replacing “11.0.*” with “10.*”, “9.*”, and so forth. Might be surprised what you find!
Control 5: Controlled Use of Administrative Privileges
This brings us to the last CIS Control that we’re going to cover here: admin privileges. There may not be a “Find Admin EZ Button” in the EDR platform, but you can start to discern and gather information about potential usage. First off, the process search in CbR has an option to query for specific user names; how about “administrator” (not case sensitive)?


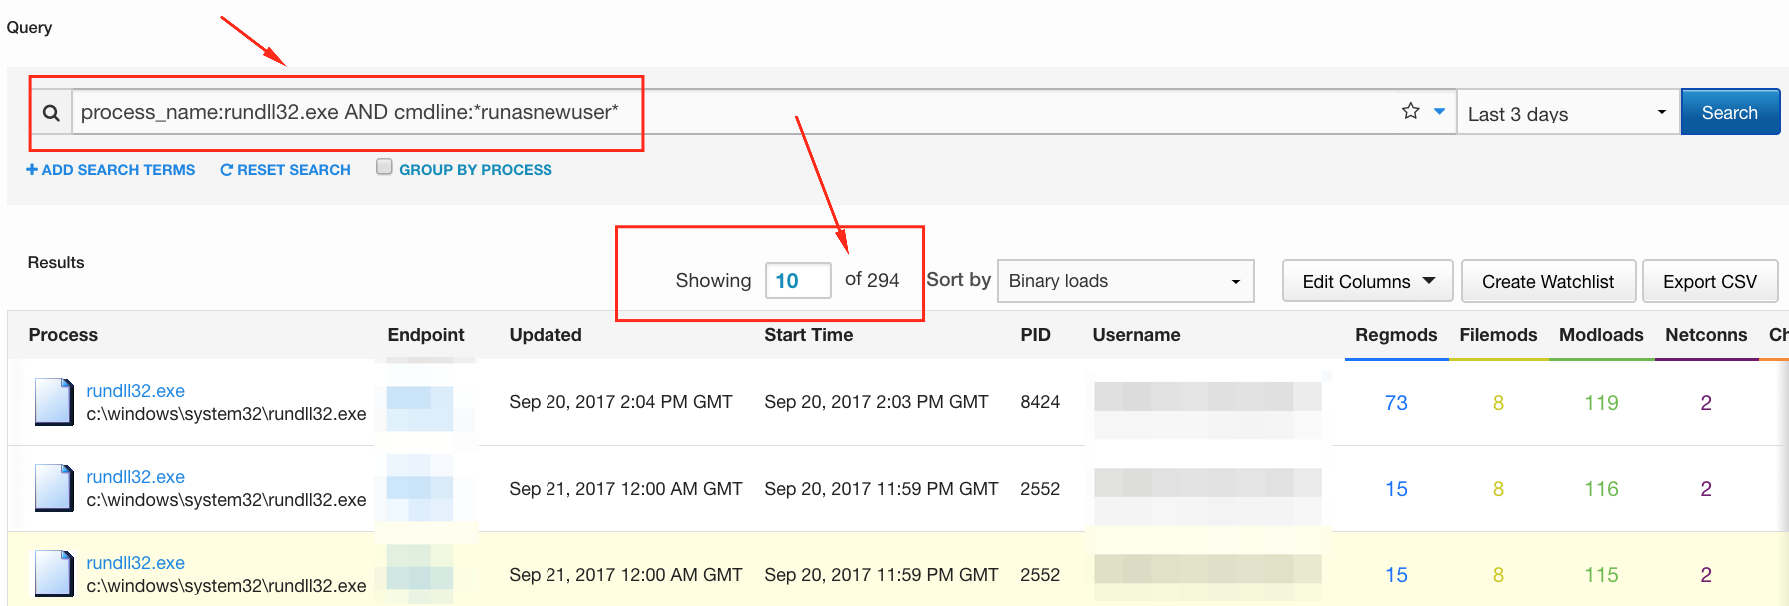

These are just a few ways that an EDR platform can be leveraged to help you take ground with the CIS Controls. That way, when someone shows up at your desk asking “What’s your SitRep?” you have one more tool at your disposal to be able to answer the question—very likely much more quickly than via other methods.
Additional Resources
- Tools: Red Canary’s free Surveyor tool leverages the Cb API and gives you another way to do queries at scale within your environment. Here’s a how-to guide to using Surveyor; you don’t have to be a Red Canary customer.
- Techniques: Explore how to use Splunk and Cb Response to take inventory (and lots of other cool stuff): Operationalizing Data With the Carbon Black and Splunk Integration
- Fundamentals: To dig deeper into the importance of the CIS Controls, check out this post: Want Better Security? Start With These 5 Proven IT Fundamentals


