Over the last 5 years I have grown very close to Splunk. The product has evolved so much over the years, but the core architecture has always been easy to deploy and understand. Splunk is known for the speed at which it can search for data, the reliability of its architecture, and the ability to spin up multiple indexers and ingest terabytes of information—all while swiftly combing through piles information. Basically, Splunk is a solid log aggregation solution. For those who aren’t familiar with it, I highly recommend taking the time to learn the basics and advanced capabilities.
Q: What’s More Awesome Than Splunk?
A: Splunk + Carbon Black Response
When I started working with Splunk a few years ago, my coworker and I began to operationalize all our data sources within the solution. We had about 10 different products in our environment and were wasting so much time jumping between each product’s console. One of our primary goals was to limit the time we needed to spend in each product—getting a “single pane of glass” in vendor-speak. We forced ourselves to do everything in Splunk. This included all investigations, data analysis, and alerting.
Our highest value data point ended up being the one thing we could get deployed across 60,000 endpoints: Carbon Black Response. In our program’s infancy, we consumed the watchlist and feed hits, knowing that the long-term strategy was to get the raw endpoint data into Splunk and drive detection there. As time went on, we began to retrieve the raw data and eventually built the Splunk App for Carbon Black Response.
Learning to Leverage Carbon Black + Splunk
To help organizations leverage the power of these two critically powerful tools in their security programs, I’ve been working with the team at Carbon Black to roll out a collection of educational materials that walk through specific how-tos, from the initial setup to advanced techniques.
This post will lay the groundwork by teaching you how to:
- Set up and configure the Carbon Black event forwarder
- Get your data into Splunk
- Use the Cb Response/Splunk app in day-to-day operations
To take full advantage of the series:
- Watch the on-demand webinar: 5 Ways Carbon Black Response Data in Splunk Can Improve Your Security
- Read Part 2: Advanced Data Analysis With CbR and Splunk
- Share your questions and feedback with me on Twitter
Now without further ado…let’s get started!
How to Set Up the Carbon Black Forwarder
The Carbon Black Dev team released the cb-event-forwarder to help customers retrieve the broadcasted data off the event bus. Simply enough, you can run this on a remote system or from the Cb master server itself. The event forwarder provides multiple ways to output the broadcasted data off the event bus including:
- udp – Have the events sent over a UDP socket
- tcp – Have the events sent over a TCP socket
- file – Output the events to a rotating file
- s3 – Place in S3 bucket
- syslog – Send the events to a syslog server
I recommend determining the architecture upfront based on what is best for your environment. We’ll dig into the architecture deeper on the upcoming webinar.
Two options I recommend:
- The S3 bucket method is the most reliable when using Splunk (while using the AWS app to connect the S3 bucket).
- If your environment is smaller (single Cb server or small 2-4 minion cluster), another great option is dumping it on the master Cb server and forwarding it to Splunk direct using the Universal Forwarder.
[table id=4 /]
Getting the forwarder installed is quite simple and the steps are provided on the repository under Getting Started.
TL;DR version:
1: Install the CbOpenSource repository if it isn’t already present:
cd /etc/yum.repos.d
curl -O https://opensource.carbonblack.com/release/x86_64/CbOpenSource.repo
2: Install the RPM via YUM:
yum install cb-event-forwarder
What should I log?
Now that you have the event forwarder installed, you will want to browse the cb-event-forwarder.conf in /etc/cb/integrations/event-forwarder/.
Make a copy of the original (cp cb-event-forwarder.conf cb-event-forwarder.conf.template) so that if anything breaks, you have the template standing by to revert.
Carbon Black is able to broadcast everything!
The short list:
- file modifications
- network connections
- registry modifications
- process start
- module loads
The long list:
Now, it may sound amazing to dump ingress.event.* into Splunk, but in reality, there are not enough use cases for modload, registry, and file modification events. Forensically speaking, it may be useful to go back in time to confirm who deleted an important file, or if a specific modload was created during a particular process execution, but in my experience we found little to no usefulness with registry, modload, and file modification events. Plus, it will save your Splunk license, which we all know we could use more of!
What I recommend:
To clarify my recommendation on data collection, the focus is primarily on just receiving process and netconn data in Splunk, along with all feed, watchlist, and binary data. Process data provides user context and command line data. The netconn data will provide us TCP||UDP, inbound||outbound, IP address, and the domain accessed.
If you have a hefty Splunk license to use for Cb Response data, feel free to ramp up with a few other data points one at a time. You’ll notice the increase near immediately. This is a gold mine! (Side Note: Every time I mention a gold mine, I think of the blog post There’s Gold in Those Endpoints: Threat Mining vs Threat Hunting, which—spoiler alert!—is exactly what you will be doing in part 2.)
To finish the setup:
1: Receive data
If you would like to use my recommendations, you can copy and paste these into each section of your cb-event-forwarder.conf:
[table id=5 /]
2: Broadcast data
Lastly, a set of changes is required within cb.conf. This will set your single instance or cluster to broadcast data on the event bus.
- Edit the
DatastoreBroadcastEventTypesoption in/etc/cb/cb.confto enable broadcasting. - Edit the
EnableSolrBinaryInfoNotificationsoptionin/etc/cb/cb.confand set it toTrue.
3: Restart
Because these variables were modified, Cb Response needs to be restarted. You can do this in /etc/cb/cb.conf by executing service cb-enterprise restart.
Configuring the Event Forwarder on a Cb Response Cluster
If you are configuring the cb-event-forwarder on a Cb Response cluster, the DatastoreBroadcastEventTypes and/or EnableSolrBinaryInfoNotifications settings must be distributed to the /etc/cb/cb.conf configuration file on all minion nodes. You also will need to stop and start the cluster using the /usr/share/cb/cbcluster stop && /usr/share/cb/cbcluster start command.
To start and stop the event forwarder:
- Start:
initctl start cb-event-forwarder - Stop:
initctl stop cb-event-forwarder
All right, so you have your event forwarder conf and cb.conf set up following the quick start guide. Now you’re ready to get your data!
How to Get Your Data Into Splunk
First, we need the Technology Addon (TA): https://splunkbase.splunk.com/app/2790/
Second, we need the Splunk App for Carbon Black Response: https://splunkbase.splunk.com/app/3336/
Where you place the TA will be determined by where you chose to place your data.
- Option 1 (S3 bucket) will require the TA on the Splunk Search Head.
- Option 2 (Universal Forwarder) will require the TA to be deployed to the Universal Forwarder.
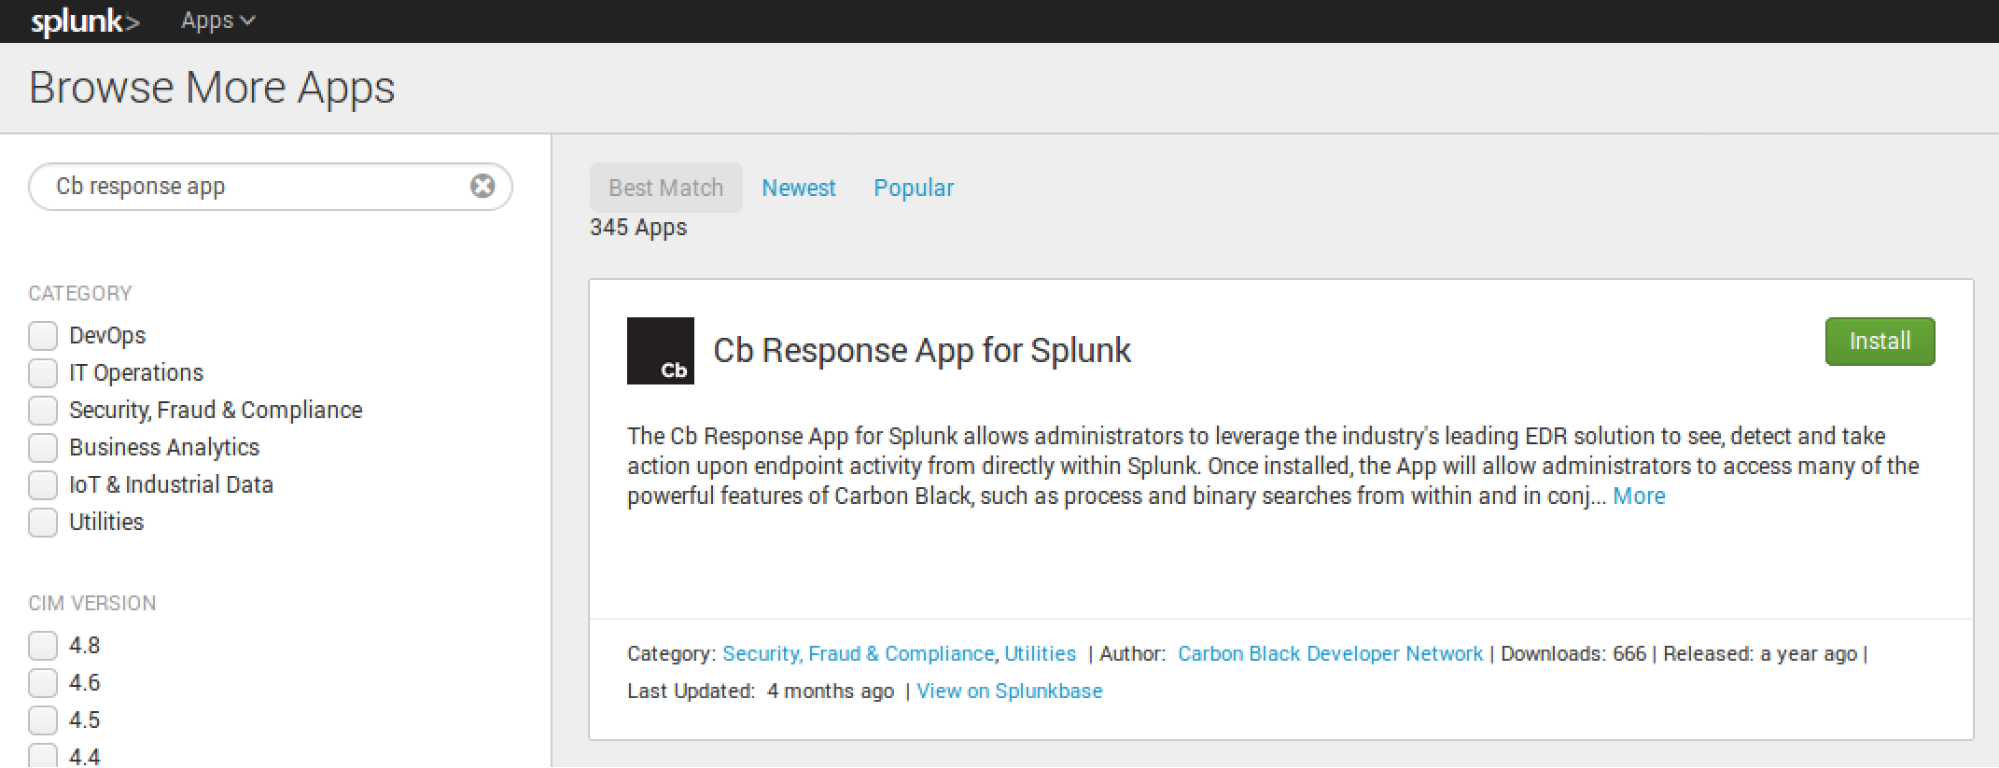
Deploying the Cb Response App is quite simple. It can either be downloaded directly on your Search Head or downloaded from Splunk Base, then uploaded to the Search Head.
To install the App from within Splunk:
1: Select Apps > Find More Apps
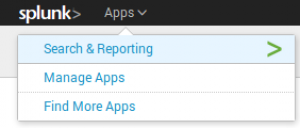
3: Select Install and follow the prompts. Once it is complete it will require a restart of Splunk.
Alternatively, download the App directly from the Splunkbase:
1: Go here to download: https://splunkbase.splunk.com/app/3336/
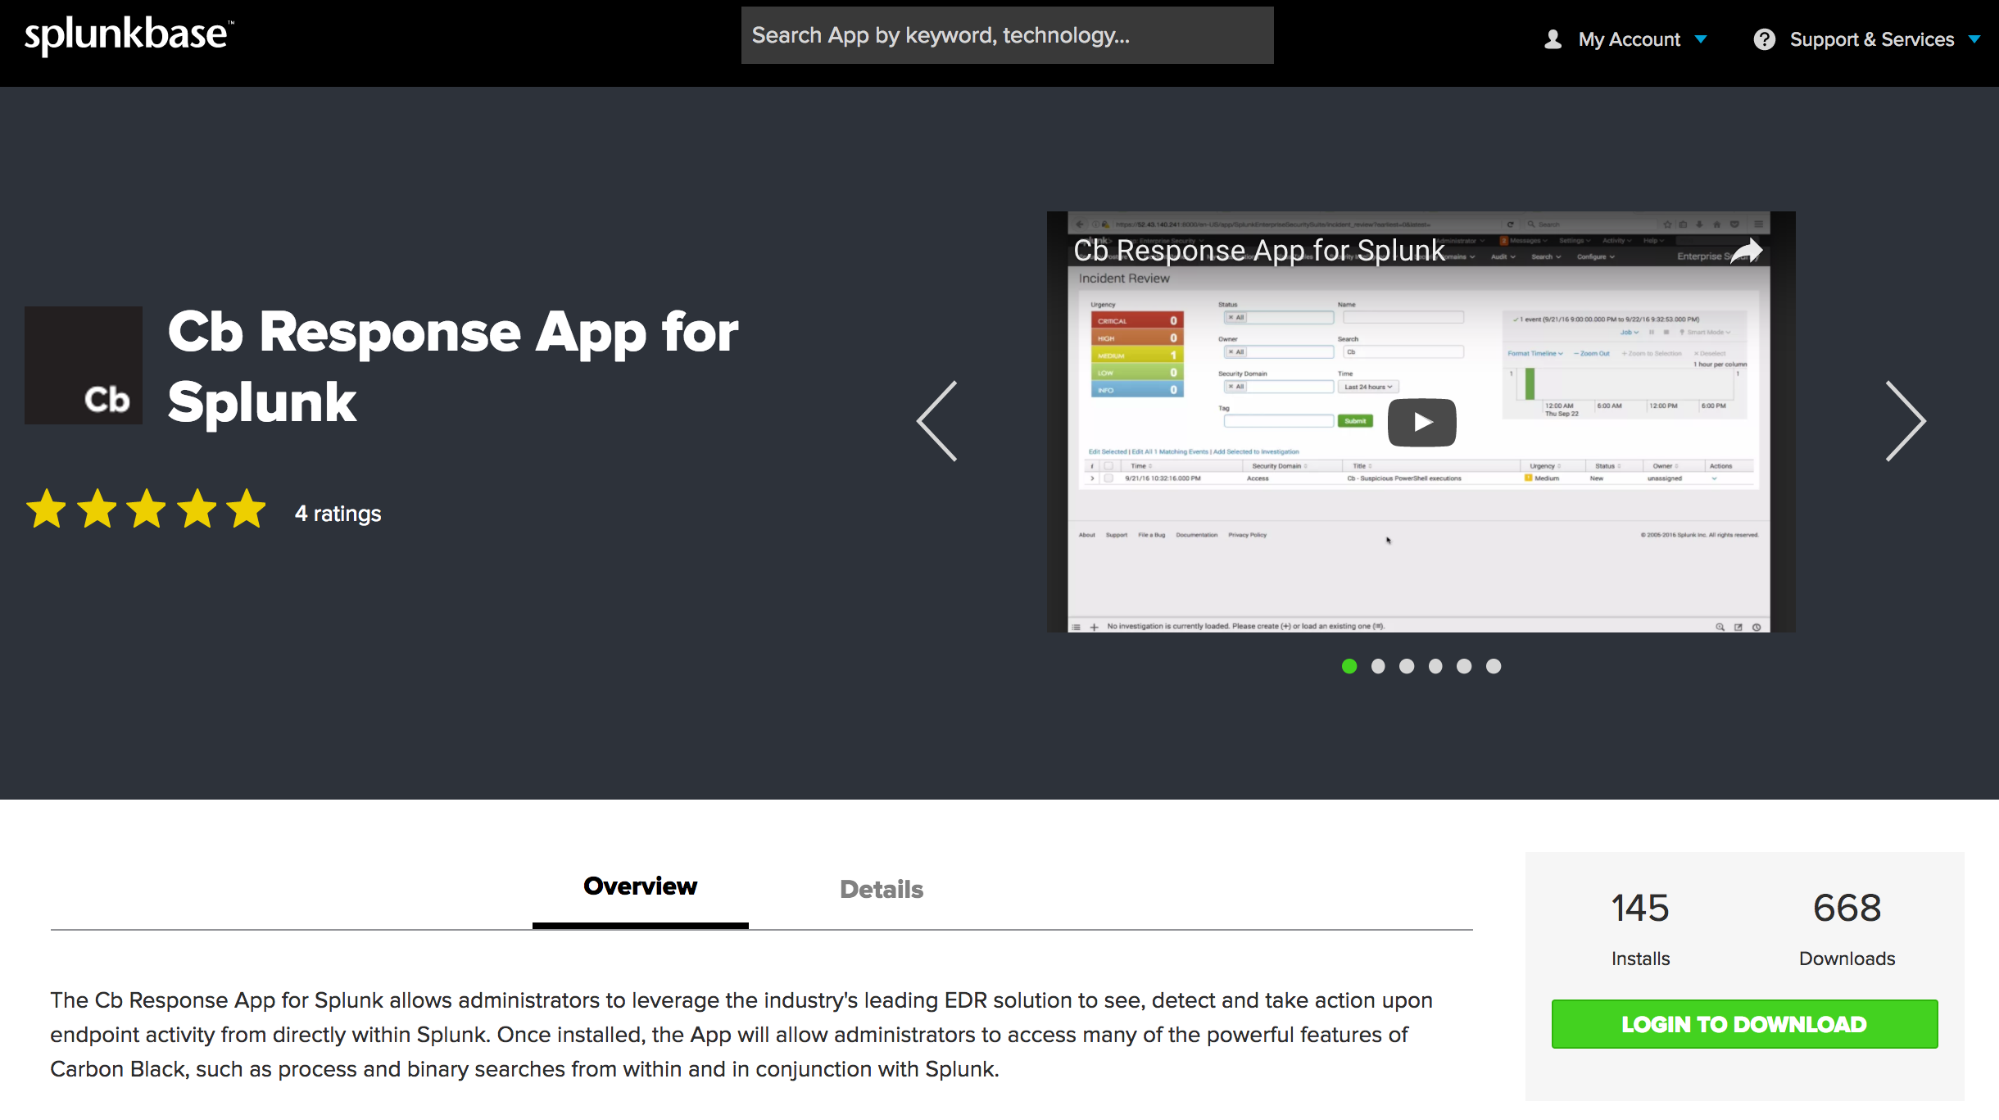
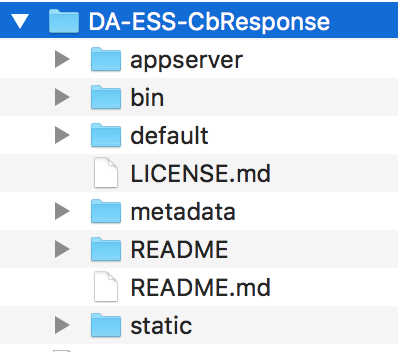
Once complete, you will have the App in your downloads directory. If interested, check out the file structure of the App by extracting the tgz file or by checking out the App’s github repository: https://github.com/carbonblack/cb-response-splunk-app/
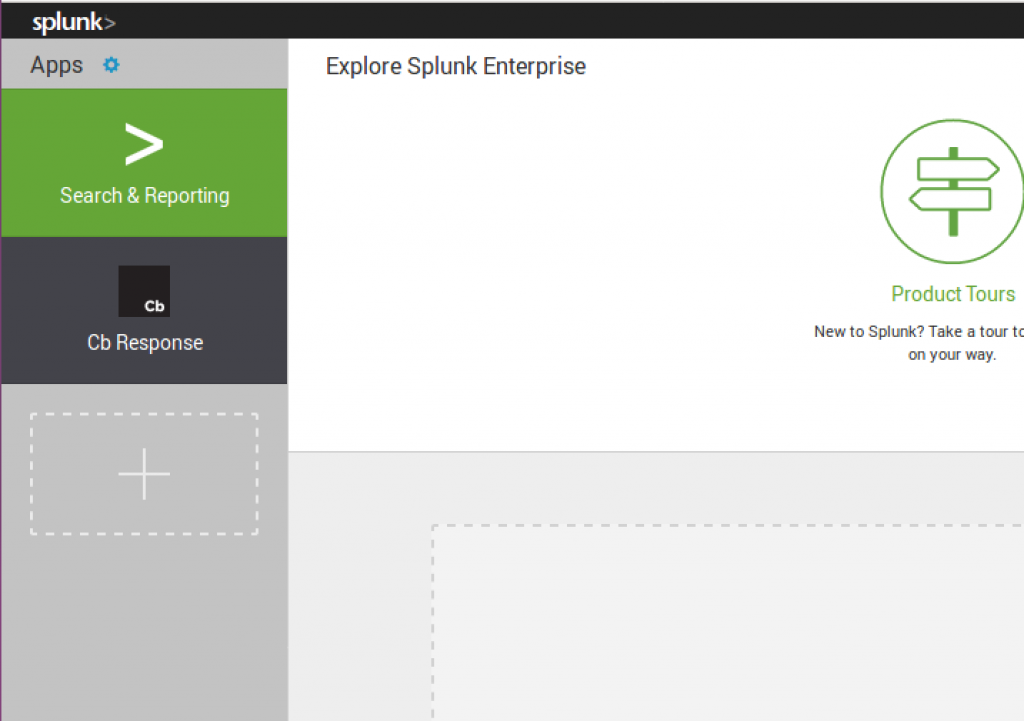
Once you get the App deployed and launch it for the first time, you will be prompted for your API token to your Carbon Black Response server. Whether or not you do this is completely optional and will not affect any of the steps I’m about to walk you through, as we will be ingesting raw event data.

You will need your CB Response server URL and API token. I recommend creating a dedicated account in CB Response and using that account’s API versus using your global account’s API token, mainly for audit reasons.

Using the Dashboard
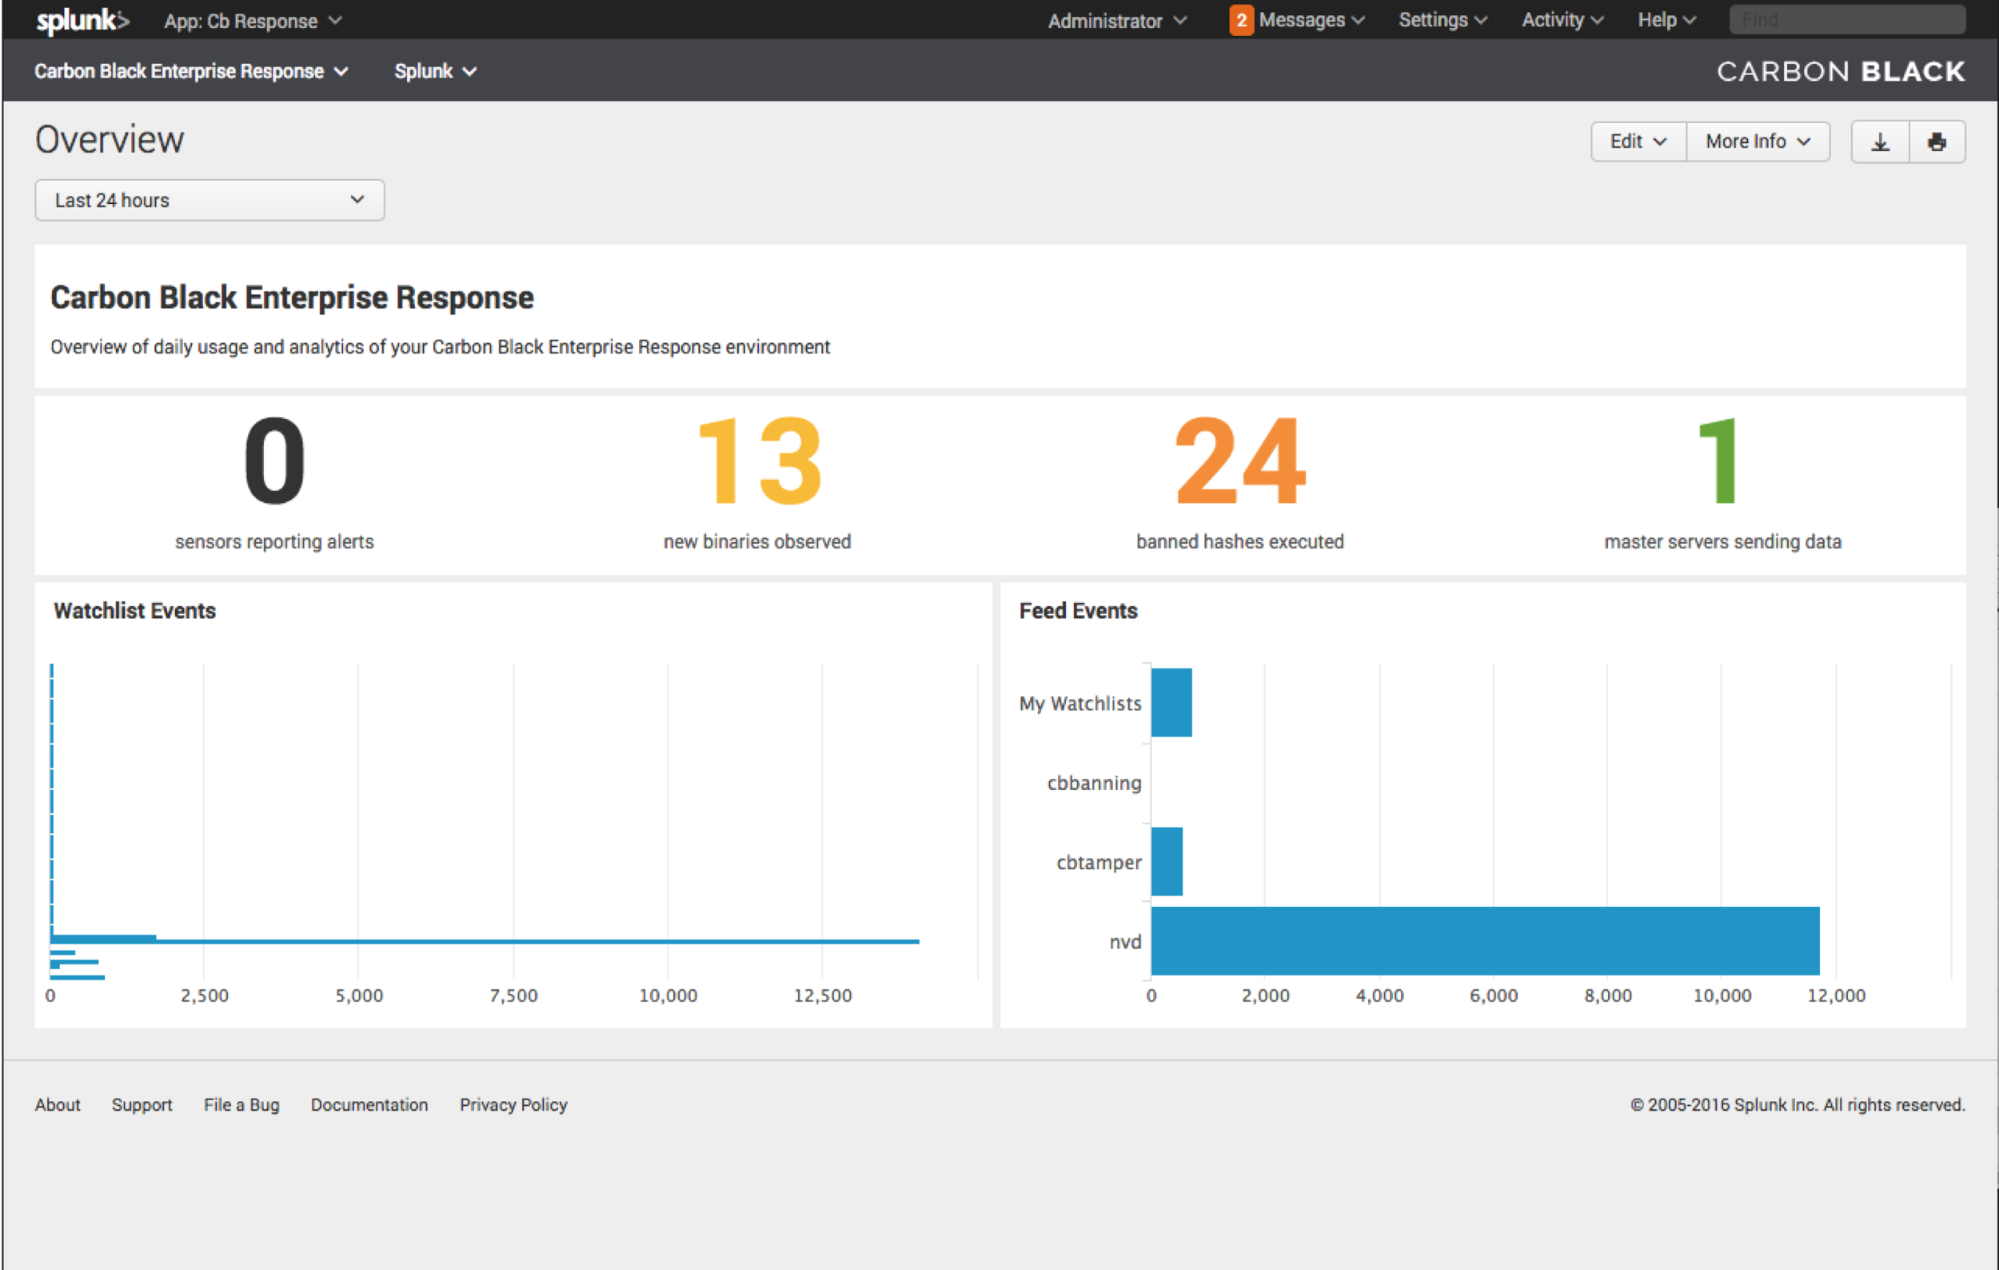
Past the API gate, you will now be presented with the default dashboard.
Whether you are searching through data or creating dashboards, it’s best to use the built-in macro within the app. The macro is `cb` (with the backticks). I recommend modifying the macro if you are using a specific index or have changed the sourcetype (default: index=* sourcetype=”bit9:carbonblack:json”).
To modify the macro:
- Access the macro via the CB Response Splunk App context under Settings > Advanced Search > Search Macros > cb
Quick link here: /en-US/manager/DA-ESS-CbResponse/admin/macros/cb?uri=%2FservicesNS%2Fnobody%2FDA-ESS-CbResponse%2Fadmin%2Fmacros%2Fcb&action=edit&ns=DA-ESS-CbResponse
Now that fresh raw event data is flowing into Carbon Black and it has the proper sourcetype of bit9:carbonblack:json, you will see the Overview dashboard begin populating.
Using the Cb Response Splunk App Day-to-Day
We built the App with the idea that our central operation would run completely out of Splunk, while only using the Cb Response interface for deeper investigative dives.
We used the App for two core functions:
- A test bed for new ways to analyze the data
- Daily operations and ensuring we were alerting on as much as possible in a timely fashion
Many of the saved searches in the App are meant to help with analyzing large sets of data quickly, not for alerting. However, with some tuning you’ll be able to get some low fidelity saved searches up to high fidelity. If not, that is okay! Some saved searches are meant to be noisy.
I’ll walk you through the basics of the App itself and then we will dig into saved searches with alerts on high fidelity items.
Dashboards
After we provided the foundation of this App to Carbon Black, Jason Garman and the development team focused on adding functionality into the App that allowed customers to perform binary and process search straight from Splunk to Cb Response using the CBAPI. This capability saves users from having to continuously go into Carbon Black, but instead lets them query Cb direct and pivot from within Splunk.
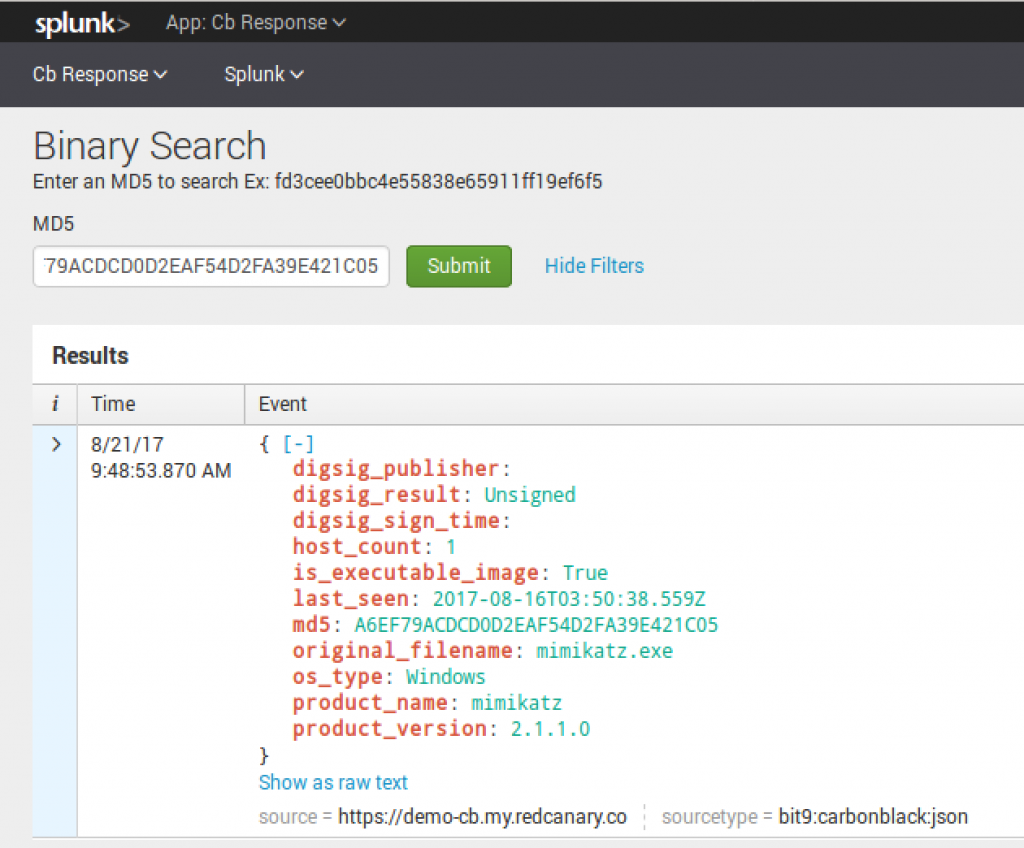
Binary Search
With Binary Search built into Splunk, we can now take an MD5 of interest and query Cb Response to see if the binary is in Cb Response. If it is present, the results will return the following:
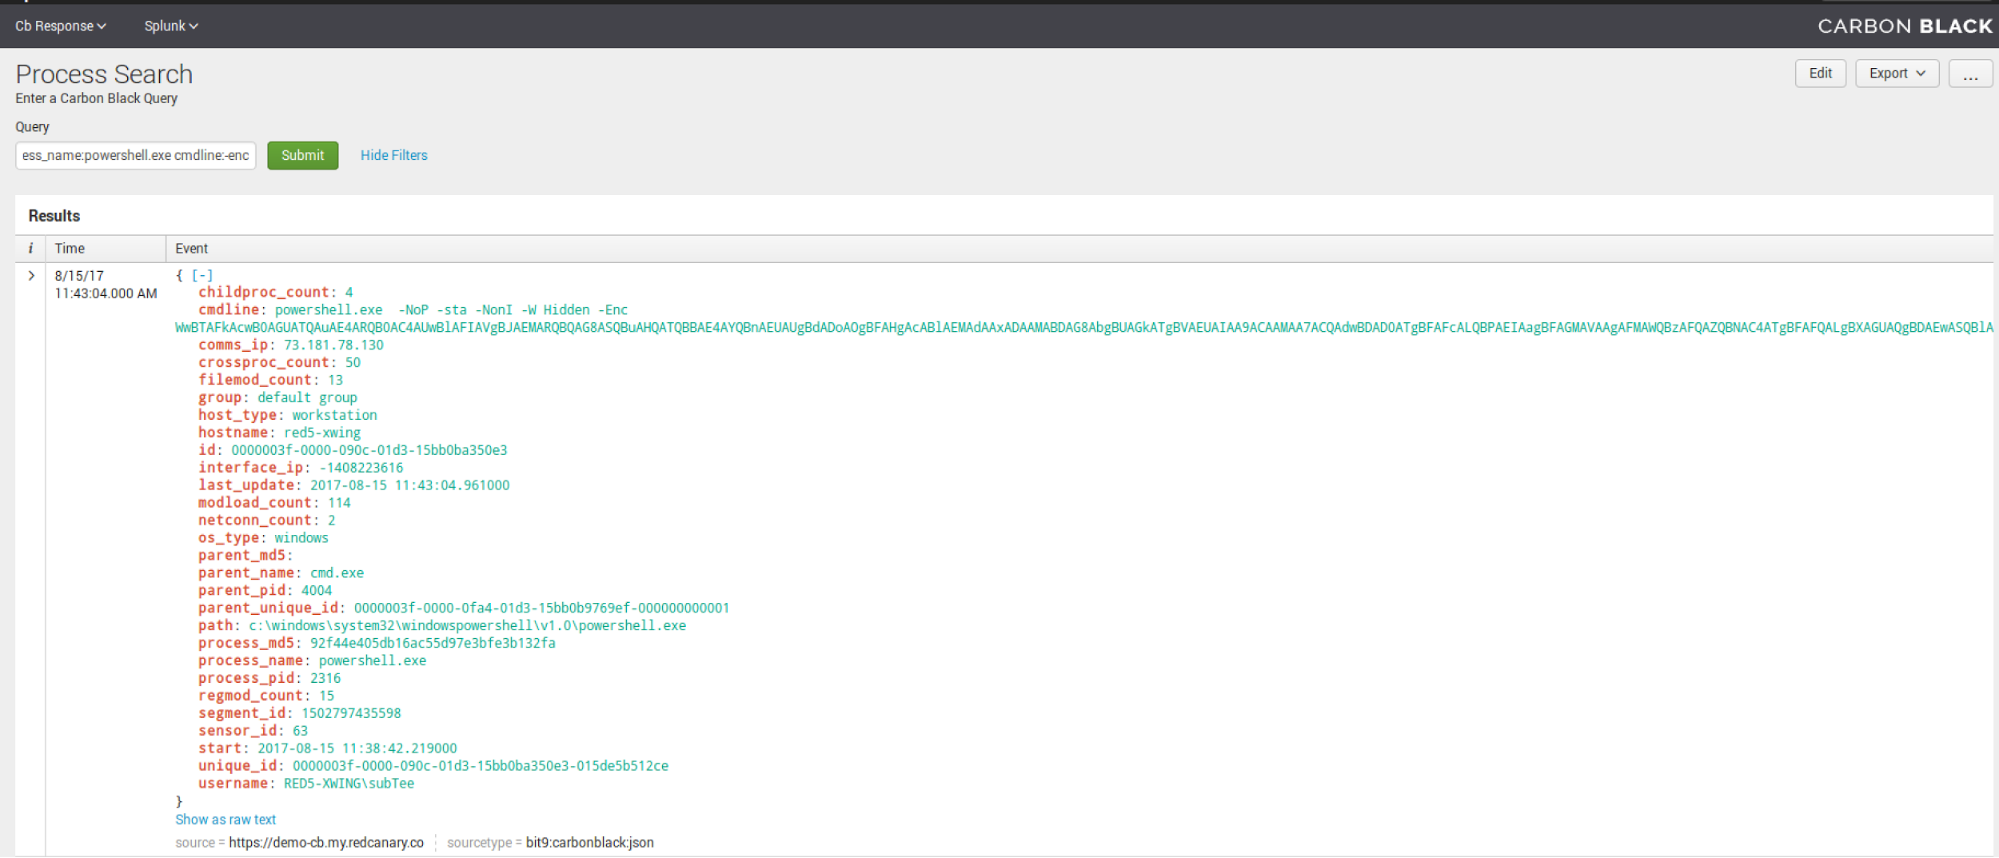
Process Search
Process search, albeit semi-similar to binary search, has a bit more granularity. In the following instances, you can use the Cb Query language to search Cb Response straight from Splunk.
For example: process_name:mimikatz.exe
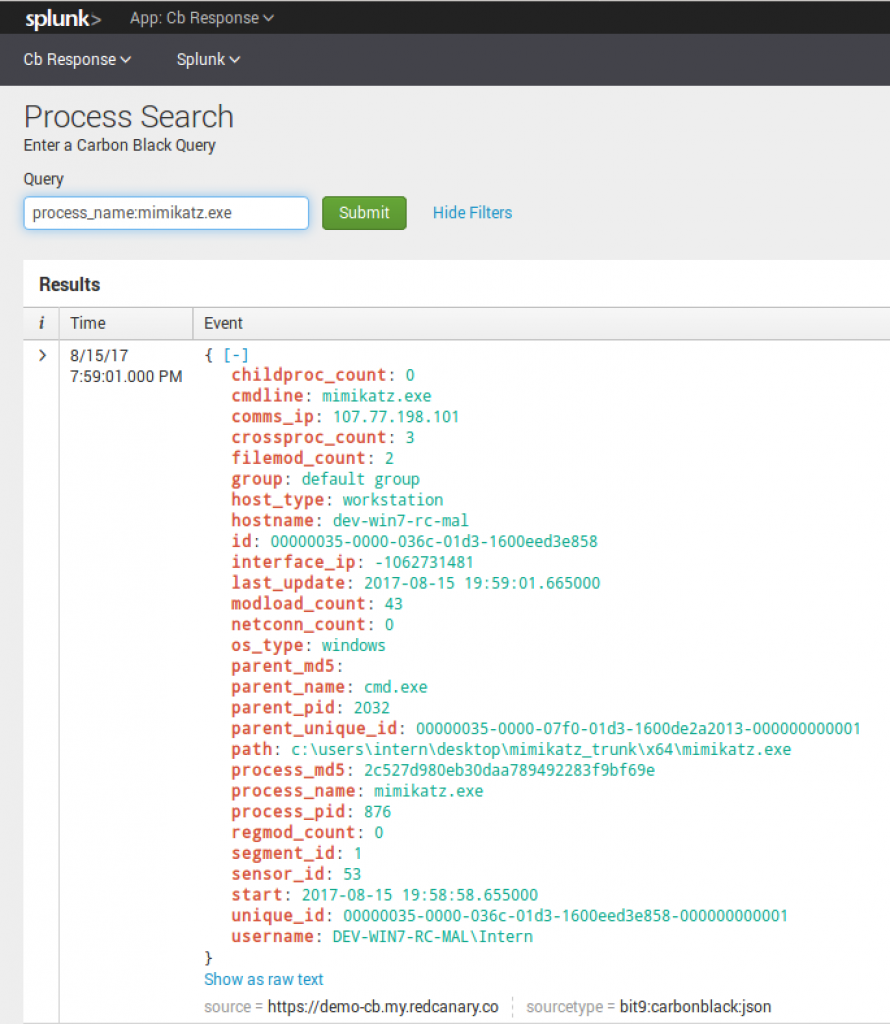
Process_name:powershell.exe cmdline:-enc
 Sensor Search
Now for some sensor administration, we have the ability to search sensors by name:

Reports and Saved Searches
Unlike the dashboards, saved searches do not require the API and instead use the raw Cb event data. To me, this is one of the most important functions of this App. By default, the App arrives with 53 saved searches. Each one is unique and performs a specific detection or provides data to be analyzed.
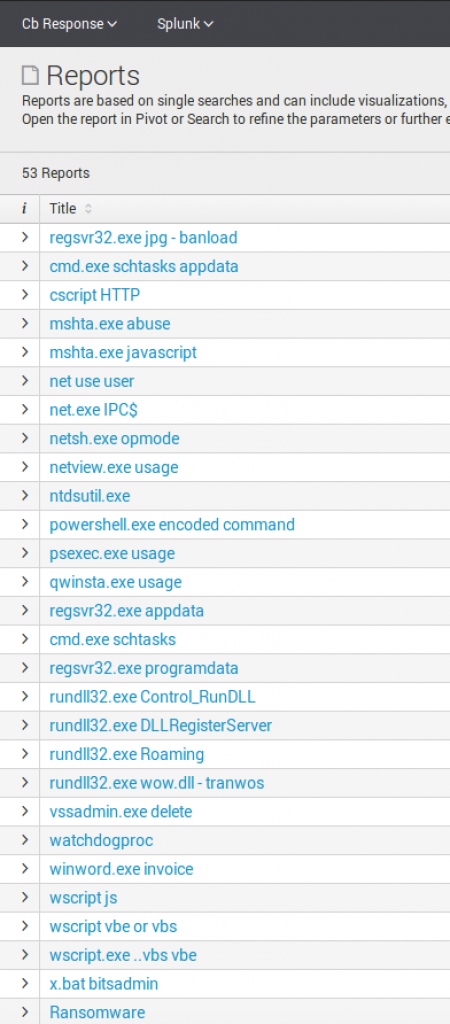
High Fidelity Report Review
High fidelity reports mean that an item should or could be used to alert on out-of-the-box with minimal environment tuning.
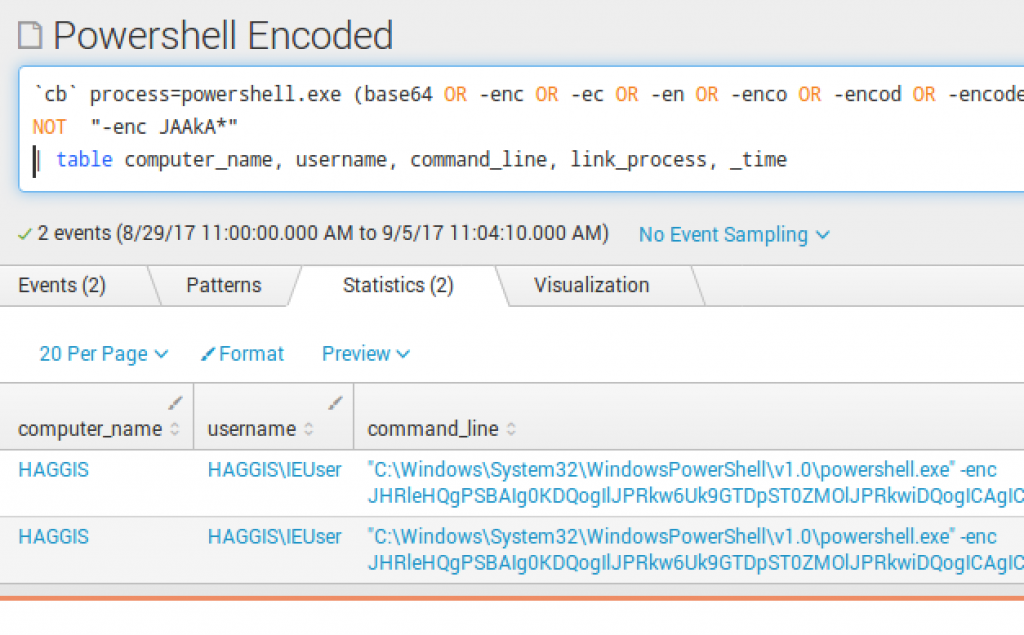
PowerShell Encoded Command

To exclude a specific command, I put NOT "-enc JAAkA*"
 Delete Volume Shadow Copies
VSSadmin.exe is routinely used by ransomware to delete volume shadow copies on endpoints upon execution. I recommend first running this across your environment (hunt) to determine any legitimate uses by applications. If needed, tune out any applications to make this high fidelity. This is one of the few times where I recommend setting this to run every 10-15 minutes to monitor for any deletion occurring. You are not going to prevent the infection on an individual box, but will be able to limit impact if the ransomware has a network spreader component.
 Data Analysis Reports
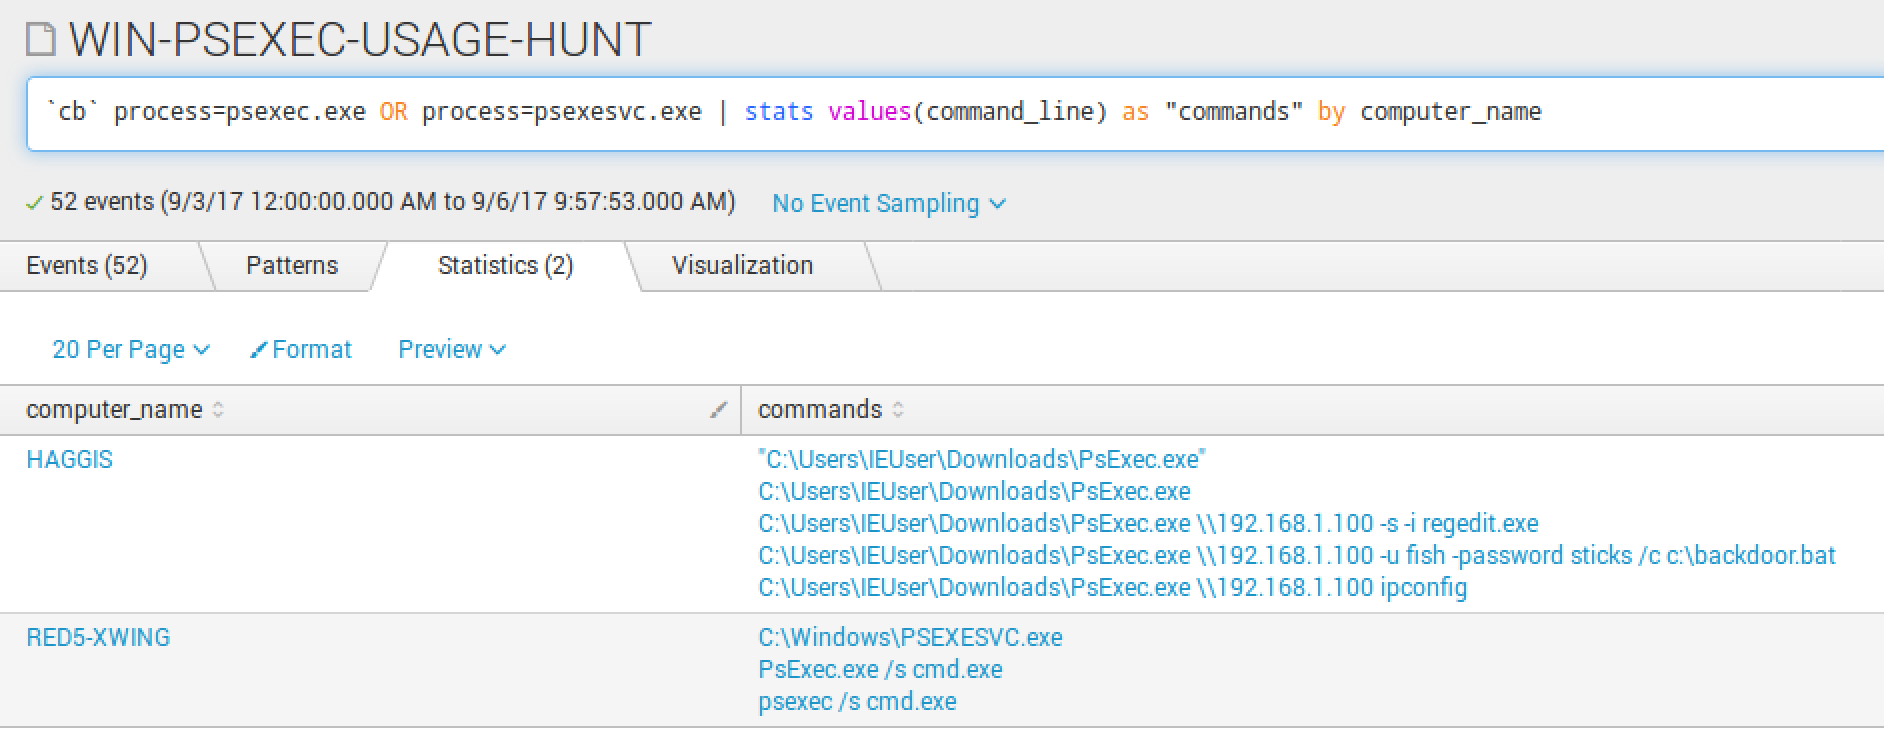
Specifically, I am going to highlight a report that may not seem like much, but is a great way to to monitor the usage of PsExec.exe.
PsExec.exe is a SysInternals utility that is used for both good and evil. Highlights from SysInternals on what psexec may be used for: “PsExec is a lightweight telnet-replacement that lets you execute processes on other systems, complete with full interactivity for console applications, without having to manually install client software. PsExec’s most powerful uses include launching interactive command-prompts on remote systems “
Some environments may be very quiet with PsExec activity and others very noisy. If your environment is quiet, it may be worth tuning this to alert upon any execution. If not, this is a great way to daily/weekly monitor execution of PsExec.
Reports are a powerful ability to sift through terabytes of raw Cb Response data historically, daily or hourly. Certain ones will hold a higher fidelity to your operation vs others. Time will be required to tune the reports for your environment. A good measure is to run a few, focus on them over a short span of time, then expand to confirm any outliers in your organization.
For example, start with running the net.exe report for a week. Tune it to where you no longer receive false positives, or events you don’t mind ignoring. After that, expand to the last month and maybe even beyond. Goal is to confirm if you have made this report high fidelity or something to run daily/weekly to monitor activity.
Alerts
Now that we have reviewed some high fidelity saved searches, we will now want to set up alerting for each time one triggers. The goal of a high fidelity alert is to ensure that when it does trigger, you know it’s worth the next 10-15 minutes to escalate and have the endpoint contained. Before ever setting a high fidelity saved search to alert, ensure that you have spent the time to tune the saved search. Do you know the accuracy of the saved search? Do you have an idea as to how many alerts will be generated?
PowerShell Encoded Command
This saved search is quite simple yet very powerful in detecting two methods of PowerShell encoded commands. The search `cb` process=powershell.exe -enc OR -encodedcommand
is looking for instances of encoded commands being executed.
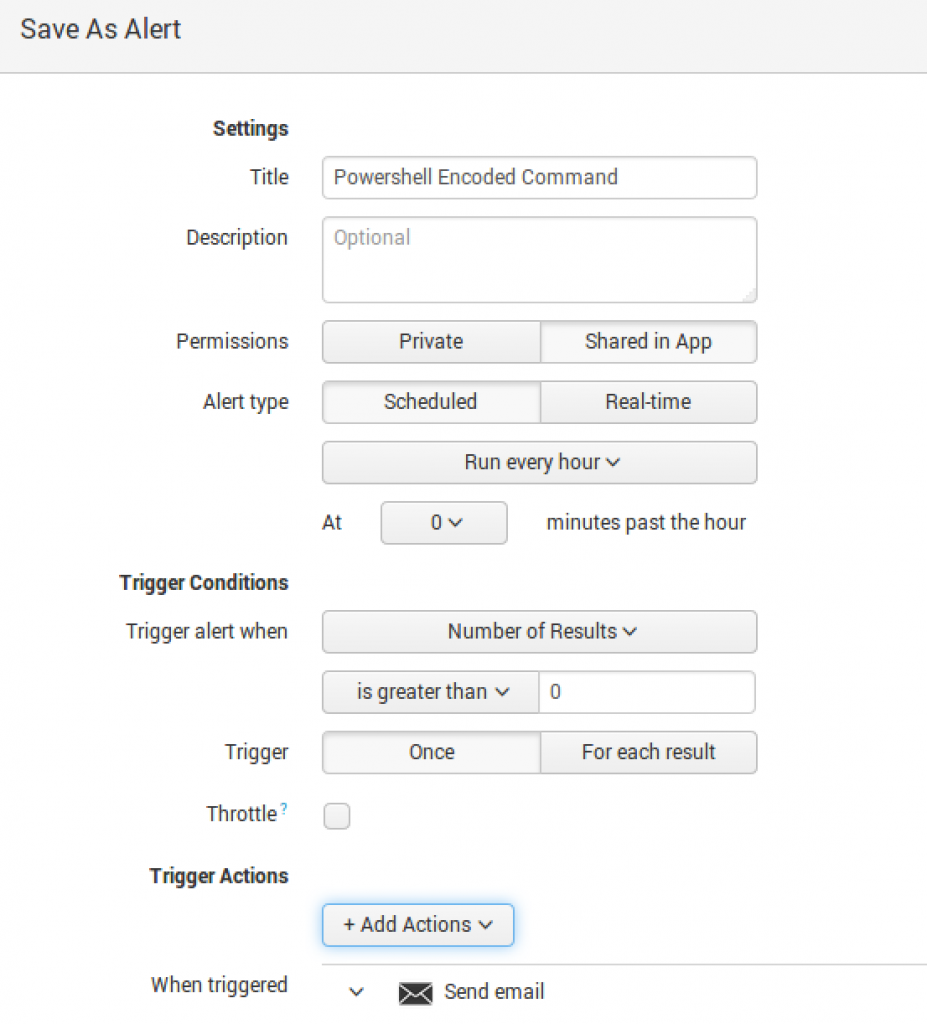
To set up the alert:
1: Run the report for a 1-hour window. In the Save As dropdown menu, select “Alert.”

2: Fill in the Title of the alert, share it within the App, or keep it Private.
I generally schedule all my saved searches to run hourly, but if it is something critical, a 15-minute window should be fine. I shy away from real-time as it will impact performance if you run multiple real-time searches.
If your environment is full of PowerShell ninjas using base64, you will want to tune this carefully.
Mshta.exe Javascript
This particular saved search is looking for: `cb` process=mshta.exe javascript:
This is a highly common detection of Kovter malware.
Example evil: Mshta.exe javascript:judNSd2v=“4S”;T80G=new%20ActiveXObject(“WScript.Shell”);OlXOQ8j4=“jWqM4PKDvF”;pd6D2R=T80G.RegRead(“HKCU\\software\\ZiqReaBa\\Xp20Zk”);qeV4j2Wz=“Y7wjctoseg”;eval(pd6D2R);WFNQgoB1b=“idEjYnCb”;”
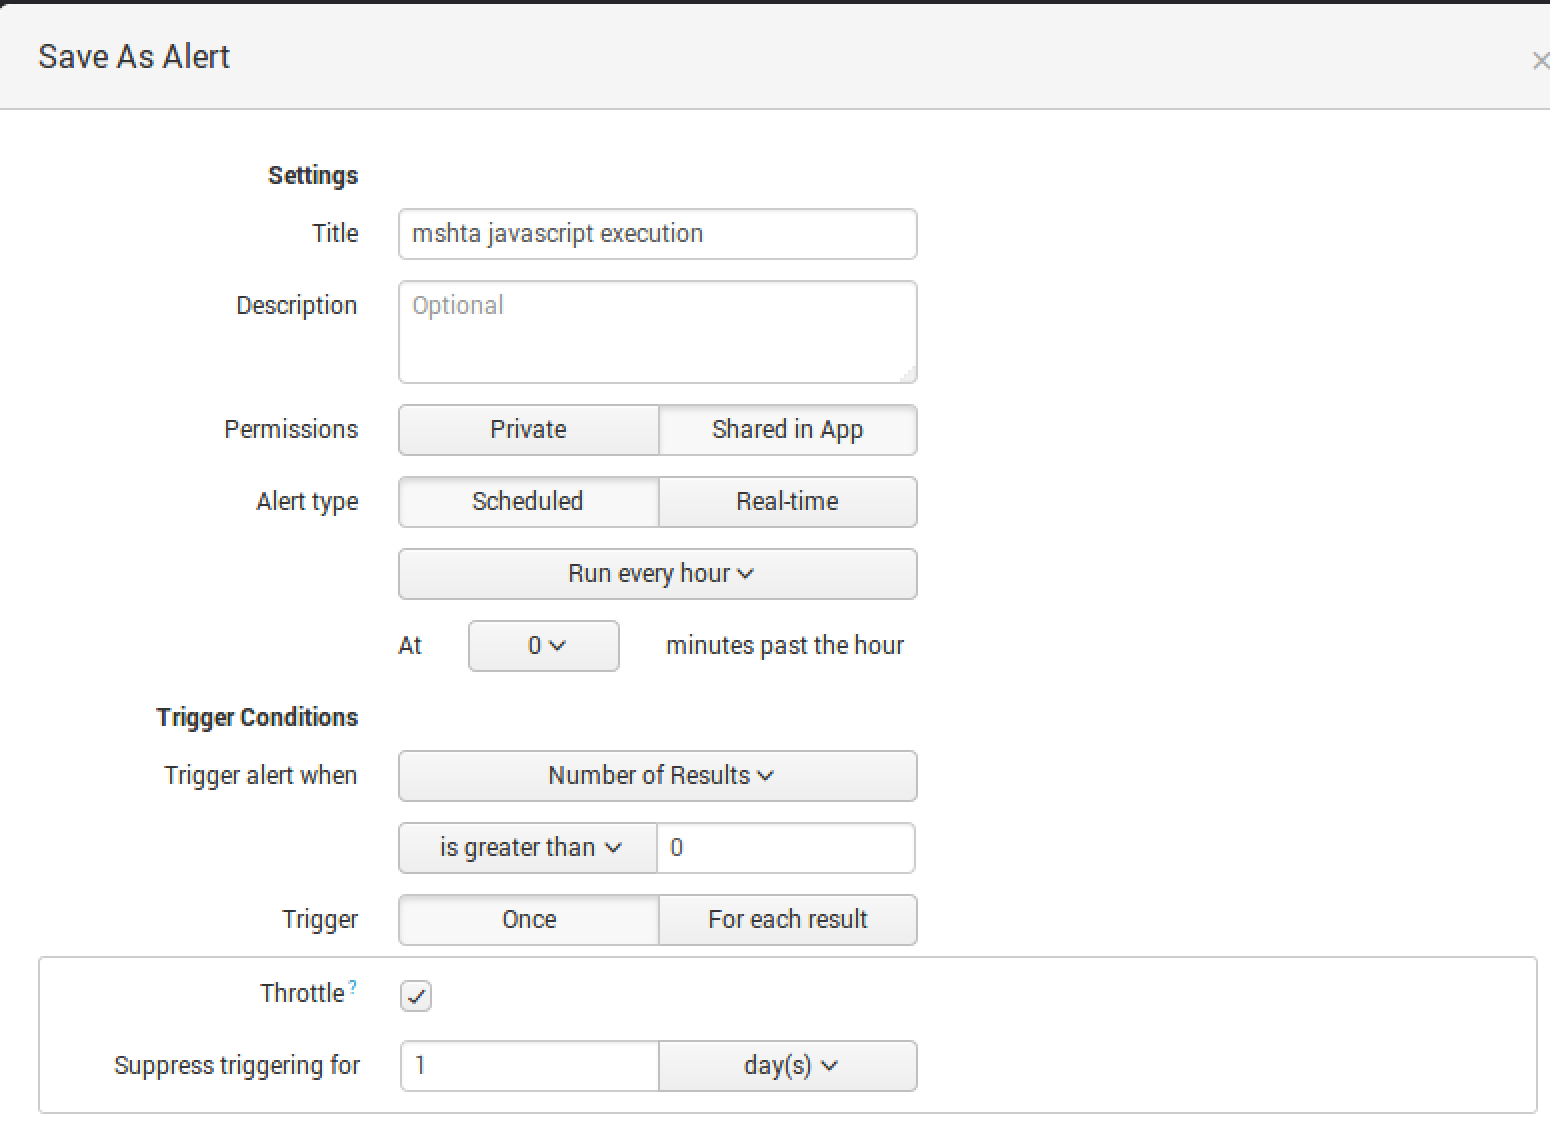
To set up the alert, run the report for a 1-hour window. In the Save As dropdown menu, select “Alert”.
Select the Trigger Action best for you.
IMPORTANT: Alerting on events should not stop you from running the reports weekly to identify any new patterns. For instance, there are many variations to run an encoded command.
Walking to Running: Advanced Techniques
Phew. We covered a lot of ground in Part 1 of this series. We focused on setting up the event forwarder, making sure Carbon Black Response is set up to broadcast the event data, reviewing dashboards, and setting reports to alert right away with minimal tuning. A highly detailed Get Started guide is available and if you have any questions feel free to send me a message on Twitter.
This is just the tip of the iceberg as far as Carbon Black and Splunk capabilities go. Remember, watch the on-demand webinar with me and Jason Garman to learn five ways Carbon Black Response data in Splunk can improve your security.
In my next blog post, we’ll go from walking to running. We will review new dashboards, data analysis and tuning, workflow actions and automation. The goal is for you to be able to walk away with a fully operational and functional detection and response organization. Read Part 2: Advanced Data Using Cb Response With Splunk
Happy Splunking!

 Sensor Search
 Delete Volume Shadow Copies
 Data Analysis Reports