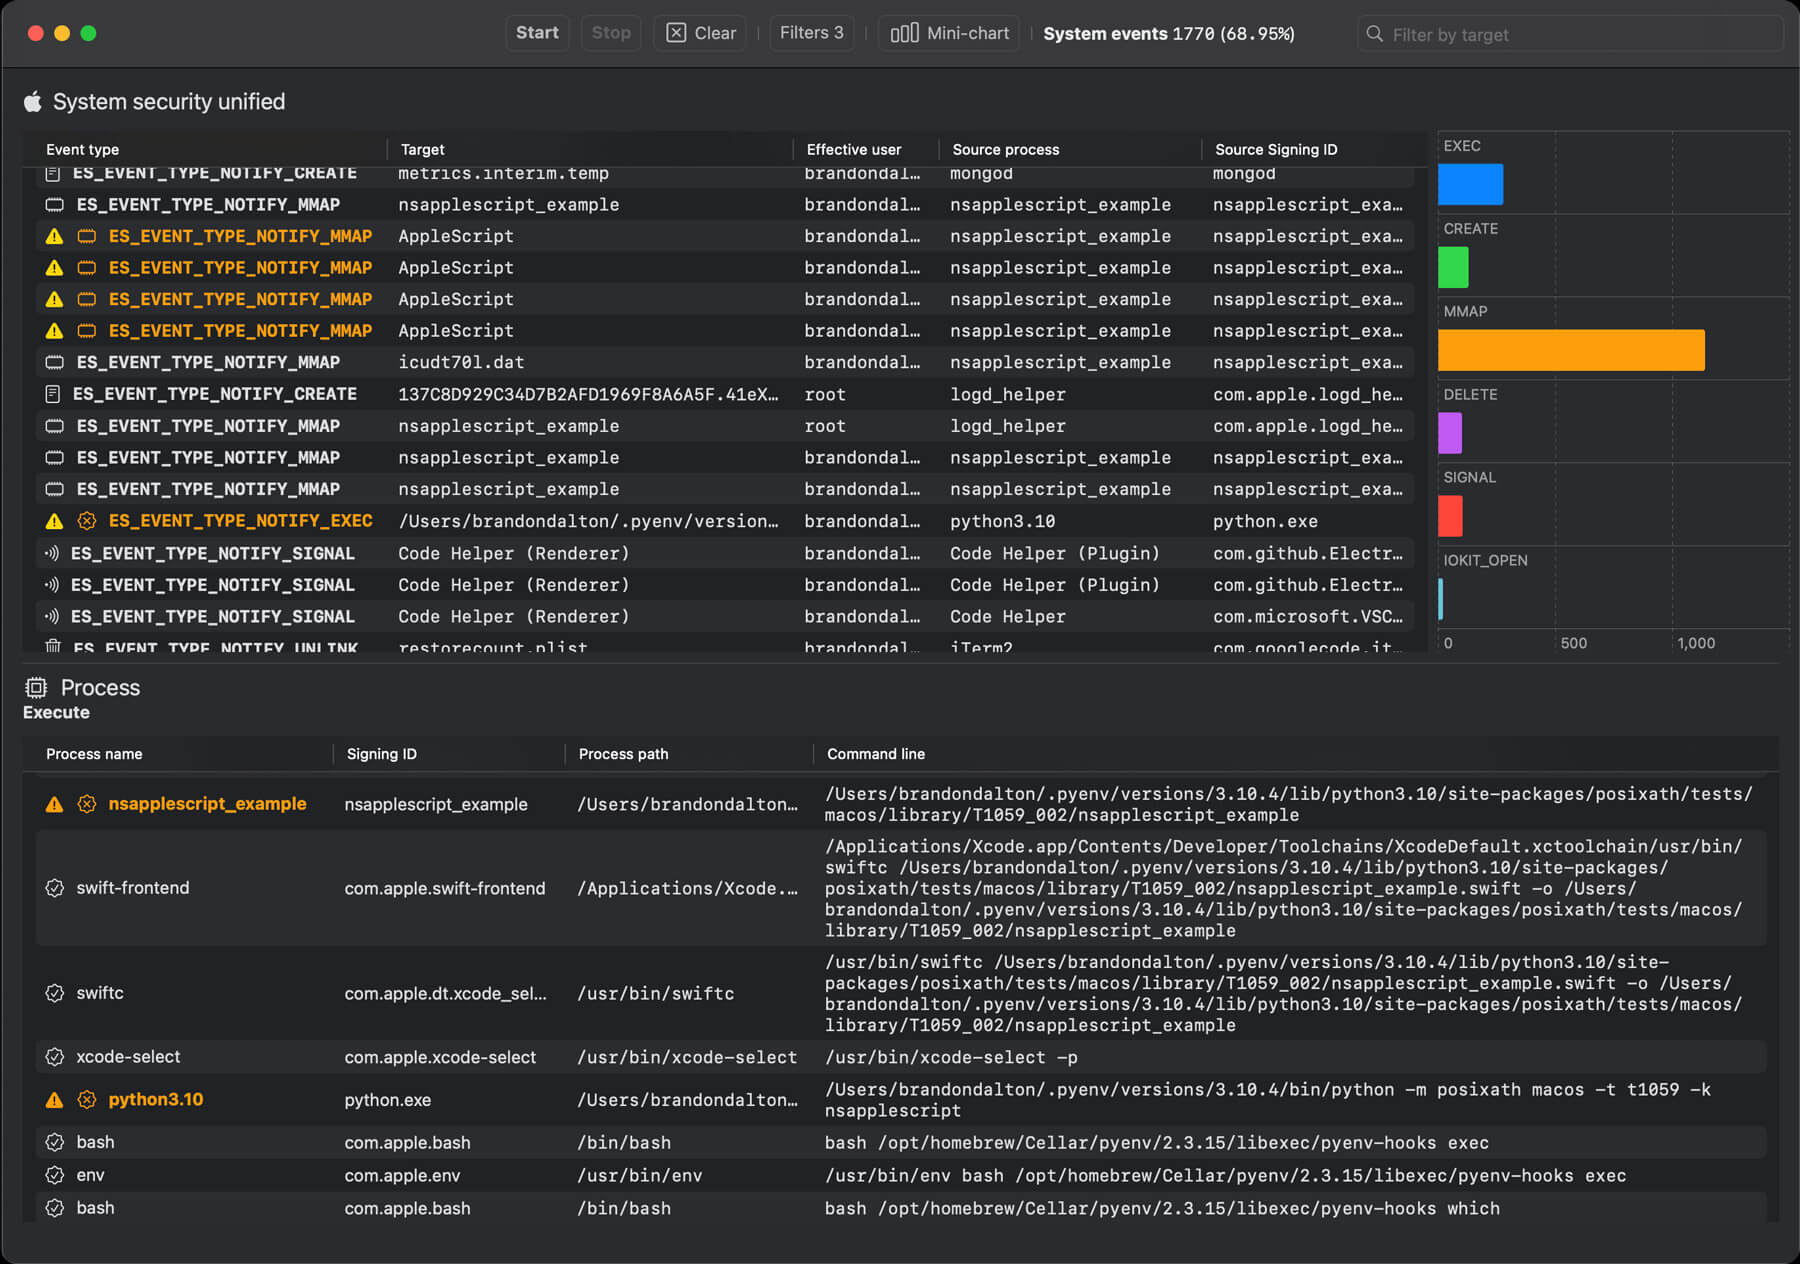
In 2019, Apple deprecated kernel extensions and introduced their Endpoint Security (ES) framework. Because of this change many EDR companies had to adapt their tools to integrate and work with this new interface. At Red Canary, our threat research team is always looking to uncover the latest threats. However, we found that the modified EDR tools we had access to did not allow us to conduct quick high-resolution analysis of Mac security events. So, we created our own solution, Red Canary Mac Monitor, which we are also making available to the community.
Mac Monitor is a distribution package available to download for free, and is designed to take advantage of the ES API to monitor and ingest process and event data that other tools are skipping. With Mac Monitor we can now collect ES events dynamically around a specific set of activities to provide targeted and dynamic macOS system event analysis. What does this mean? It means we can go deeper, analyzing data others aren’t to identify threats that others miss.
Download PackageOverview
So what is Red Canary Mac Monitor looking at?
32 high-impact endpoint security events we have modeled across:
- Process
- Interprocess
- Code signing
- File
- File metadata
- Memory mapping
- Login
- Background Task Management (BTM)
- XProtect
As new research is published, threats evolve, and Endpoint Security (ES) is updated (with new versions of macOS) we will add support for additional events. You can find a full list at our GitHub repo here.
What does Mac Monitor help do?
Mac Monitor will serve the macOS / Apple security research community by allowing users to produce cutting-edge, high-quality, and reproducible macOS threat research. ES knowledge within the public domain is extremely scarce, and we hope this will help to remedy that. Additionally, Mac Monitor will help the broader security community dig deeper into the telemetry generated on macOS allowing us to improve threat research within the Apple security space.


features
Easy-to-use UI that is quick to set up and configure
Dynamically subscribe to the events you want to track
Export your telemetry in JSON format
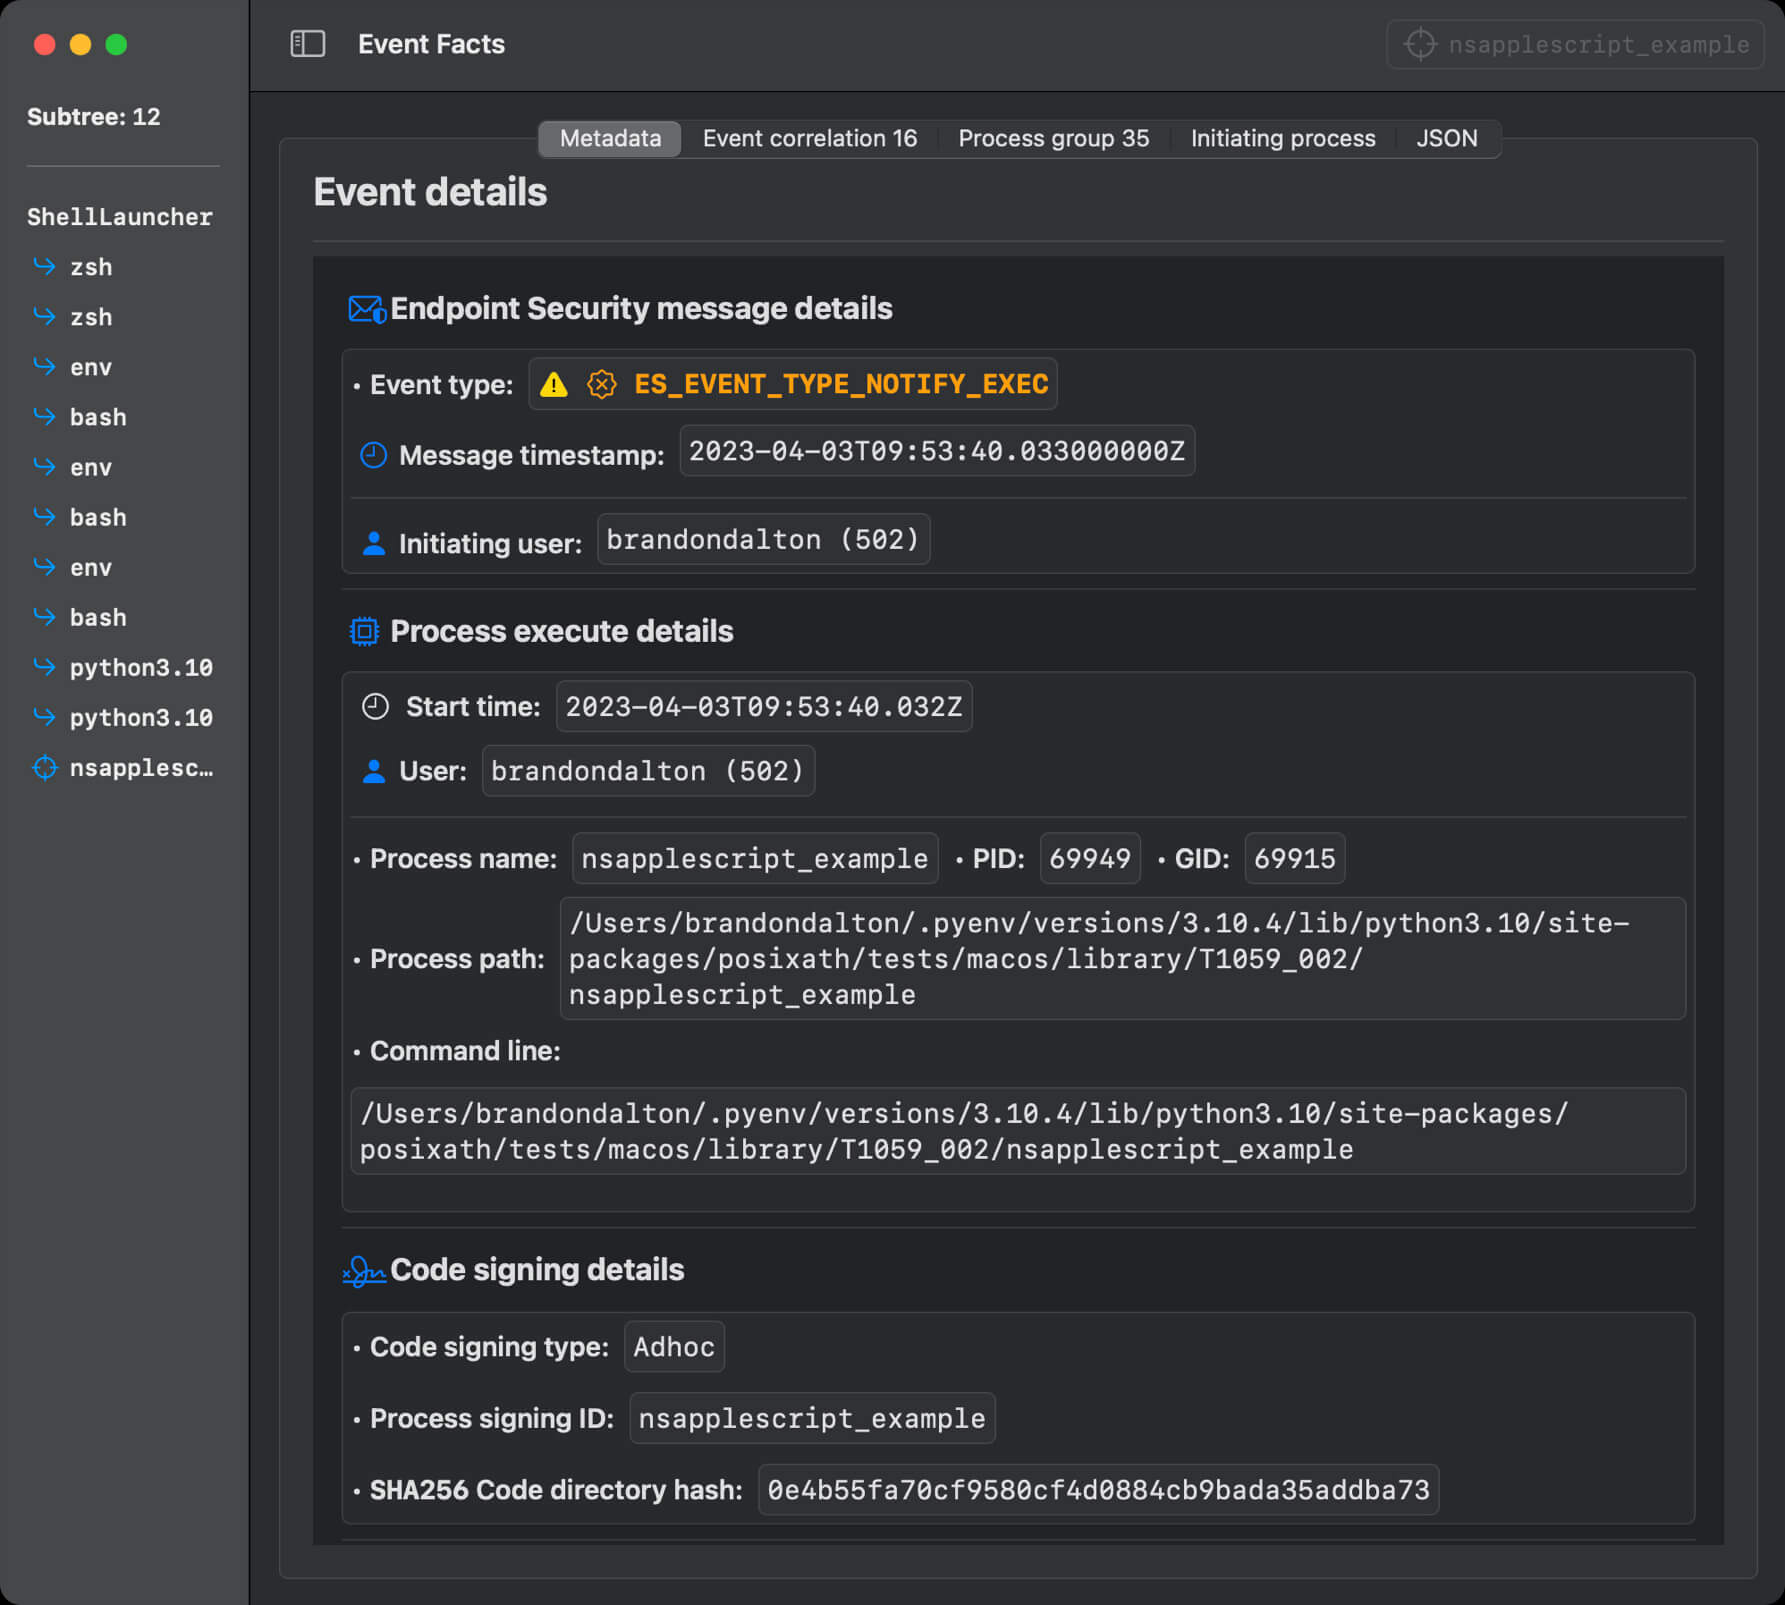
Automatic correlation of events and grouping of processes to identify suspicious activity
Customizable path muting and object filtering to adjust your view to focus only on the information you need
Granular details across events, including the metadata, are directly reported by ES as is other relevant information (like code signing certificates for process execution events)