
Editor’s note: We originally published this article on May 7 as part of our Blue Mockingbird research. MITRE has since added the COR_PROFILER technique detailed in this blog to the ATT&CK® Framework. As such, we wanted to present this work to our readers again—and add references to its new ATT&CK page: COR_PROFILER (T1574.012).
We believe that security teams should prioritize their detection efforts according to the threats that are most likely to affect them. In fact, that’s one reason we produce our annual Threat Detection Report, which analyzes the top MITRE ATT&CK techniques observed across our customer base and by industry.
When it comes to persistence, Scheduled Task (T1053) ranked second overall and even topped the list for a couple of industry verticals in 2019. Today, we’d like to talk about a novel form of persistence that the Red Canary Cyber Incident Response Team (CIRT) has observed an adversary leveraging in multiple incident response (IR) engagements. My colleague Tony Lambert has broken down the adversary behaviors and TTPs in this blog post.
Component Object Model (COM) hijacking (T1122) did not come anywhere close to the top of our 2020 report (it barely cracked the top 100). This doesn’t mean it isn’t leveraged by adversaries—rather, it’s usually the same “tried and true” methods of persistence (scheduled tasks, autorun registry keys, services, etc.) that we see used over and over again that dominate our Threat Detection Report. This is why we urge new security teams to focus on detecting the most likely forms of persistence.
An adversary we’ve dubbed “Blue Mockingbird” leveraged multiple forms of persistence when deploying their primary payload consisting of XMRIG packaged as a dynamic link library (DLL), including:
- Scheduled Tasks (T1053)
- Modify Existing Service (T1031)
- New Service (T1050)
- COM Hijack using COR_PROFILER (T1574.012)
We have detection logic for catching each of the techniques listed above, but the COR_PROFILER technique is pretty unusual. So let’s take a closer look.
COR_PROFILER for managed code development
The .NET framework supports the loading of an unmanaged (something outside the .NET framework like C++, which interacts directly with hardware) profiler DLL as a code profiler to monitor a managed application. This feature is intended to allow the unmanaged profiler DLL to load into any .NET process and interact directly with callback interfaces through a profiling API to receive information about the state of the profiled application. Essentially, this means .NET developers can measure their managed code performance with an unmanaged DLL, which aids in troubleshooting and debugging their managed application.
For our purposes, we will be looking at startup-load profilers, which are attached to the unmanaged profiler when a managed application starts. A startup-load profiler can be registered by adding a few environment variables. Per Microsoft:
COR_ENABLE_PROFILING=1
- A value of 1 will enable the
COR_PROFILER, while 0 will disable it.
COR_PROFILER={CLSID of profiler}- Prior to .NET Framework 4, this CLSID must be specified and map to a COM object specifying the location of the profiling DLL on disk. This can be any CLSID of the attackers choosing.
COR_PROFILER_PATH=full path of the profiler DLL
- This environment variable was added with .NET Framework 4 and will skip searching the Registry for the corresponding COM object specified in the
COR_PROFILERenvironment variable for the path to the profiling DLL on disk. IfCOR_PROFILER_PATHis set, any arbitrary CLSID can be used for theCOR_PROFILERenvironment variable.
In Windows, environment variables can have three scopes. The location of the COR_PROFILER environment variable definition dictates which types of processes will be profiled. Knowledge of these scopes can help inform a detection strategy when environment variables are abused.
Machine (or system) scope
- Machine environment variables are inherited by all downstream users and processes. Modifying machine environment variables requires administrative permissions. These environment variables are stored in the
HKEY_LOCAL_MACHINE\SYSTEM\CurrentControlSet\Control\Session Manager\Environmentregistry hive. - Blue Mockingbird leveraged this type of environment variable, resulting in a more reliable persistence mechanism as all .NET processes loaded the malicious profiling DLL regardless of whether or not a user was logged on.)
User scope
- User scope environment variables are only available to individual users and include all machine environment variables. These are stored in the current user registry hive at
HKEY_CURRENT_USER\Environmentand in each respective user hive. For example, here is where the system account environment variables are stored:HKEY_USERS\S-1-5-18\Environment
Process scope
- Process environment variables are constructed from the machine and user scope environment variables. Child processes inherit any process scope environment variables from their parent process. Process scope environment variables are only available to the current process and any of its children. These variables are generally set using something like the SET command in Command Prompt, the $Env PowerShell variable, or by the Environment.SetEnvironmentVariable .NET method. This is generally where a conservative .NET developer would place their
COR_PROFILERenvironment variables.
COR_PROFILER and COM
Early versions of .NET Framework required the COR_PROFILER to be attached to a COM object in the registry. Beginning with .NET Framework 4, a registry-free COR_PROFILER can be configured by specifying the COR_PROFILER_PATH to the unmanaged profiling DLL on disk and any arbitrary CLSID. The CLSID does not need to actually exist in the registry as the CLR will load the specified DLL in COR_PROFILER_PATH without initializing COM.
COR_PROFILER and red teams
In May 2017, Casey Smith wrote a blog post outlining the potential for this feature to be abused by an adversary to hijack legitimate .NET processes and load a malicious unmanaged DLL. Since then a few researchers and red team bloggers have expanded on this technique as a method of persistence, bypassing User Account Control (UAC) (T1088) and Applocker restrictions when DLL enforcement is not turned on. There is also Invisi-Shell, which leverages a DLL profiler to hook .NET assemblies responsible for PowerShell’s logging and the Antimalware Scanning Interface (AMSI).
COR_PROFILER in the wild
There are multiple methods of modifying the environment variables required to configure the COR_PROFILER. For example, Reg.exe, Setx, and the Registry Editor (regedit.exe) are good candidates. Blue Mockingbird employed the Windows Management Instrumentation (WMI) command-line utility, Wmic.exe, to add the COR_PROFILER as machine (system) environment variables. You can see a complete list of the commands Blue Mockingbird leveraged in my colleague Tony’s blog post.
We have observed adversaries registering the CLSID COM interface specified in the COR_PROFILER environment variable in the Windows Registry to ensure backwards compatibility on machines with versions of .NET Framework lower than version 4. This makes sense, as an adversary will want to ensure their persistence mechanisms are resilient and work regardless of the environment. If the machine they land on is running .NET Framework 4, the malicious DLL specified in the COR_PROFILER_PATH will be loaded and the COM interface will not be used.
If the machine is running versions of .NET Framework lower than 4 and the COR_PROFILER_PATH environment variable is supplied, the technique will still work as the malicious DLL in the registered COM interface will be loaded.
In our experience with the COR_PROFILER technique, what results is a stealthy persistence mechanism that executes each time any process loads the .NET CLR. Native Windows processes like PowerShell and the Microsoft Management Console (mmc.exe) load the .NET CLR, and any installed application written in .NET will load the CLR. This results in the malicious profiling DLL loading into the memory space of each of those processes and deploying more traditional forms of persistence like services and scheduled tasks that seemingly appear out of thin air.
It’s worth noting the malicious profiling DLLs we’ve observed in IR engagements were not detected by antivirus scanners on VirusTotal. It’s also worth noting that Microsoft’s Autoruns does not check for the COR_PROFILER leveraged for persistence.
Detection Analytics
To aid defenders in detecting malicious COM Hijacking and UAC bypass leveraging the COR_PROFILER, we’ve released three Atomic Red Team tests. The first test uses user scope environment variables and registers a COM object in the Registry. This test leverages PowerShell to modify COR_PROFILER user scope environment variables in the Windows Registry and deploys an unmanaged payload DLL written in C++.
Here is an example of what the user scope environment variable modifications look like in endpoint detection and response (EDR) telemetry:
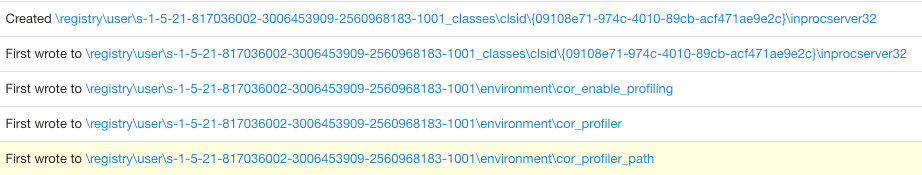
The second Atomic Red Team test leverages machine (system) scope COR_PROFILER environment variables similarly to how we have observed adversaries abuse this technique, with a slight twist. This test does not add a COM object associated with the CLSID GUID we set in the COR_PROFILER environment variable. This technique requires .NET Framework 4 or higher, which ships with all modern versions of Windows. This technique also requires the machine to reboot for the system environment variables to take effect.
Here is an example of what the system scope environment variable modifications look like:

The third test leverages Registry-free user scope COR_PROFILER environment variables. Again, .NET Framework 4 is required. This technique will not bypass UAC.
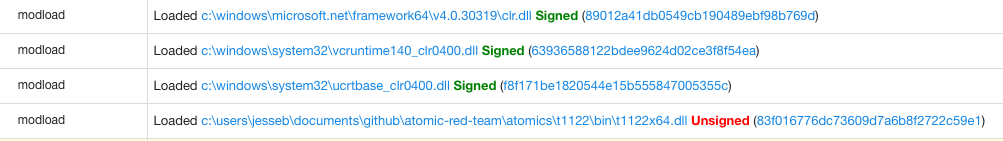
Here is an example of the unmanaged profiling DLL loading into PowerShell shortly after the CLR is loaded:
Detection strategies should focus on suspicious modifications to the environment variables associated with the COR_PROFILER in the System and User registry hives. This will ensure you can detect COR_PROFILER modifications regardless of the method employed to set environment variables.
User scope:
HKEY_USERS\<user_sid>\environment\cor_enable_profiling
HKEY_USERS\<user_sid>\environment\cor_profiler
HKEY_USERS\<user_sid>\environment\cor_profiler_path
Machine (system) scope environment variables can be detected by looking for the same registry modification in HKEY_LOCAL_MACHINE\SYSTEM\CurrentControlSet\Control\Session Manager\Environment\:
HKEY_LOCAL_MACHINE\SYSTEM\CurrentControlSet\Control\Session Manager\Environment\cor_enable_profiling
HKEY_LOCAL_MACHINE\SYSTEM\CurrentControlSet\Control\Session Manager\Environment\cor_profiler
HKEY_LOCAL_MACHINE\SYSTEM\CurrentControlSet\Control\Session Manager\Environment\cor_profiler_path
Note: process scope environment variables are stored in memory. Higher integrity child processes do not inherit these environment variables if their parent process is of a lower integrity, therefore, UAC is not bypassed.
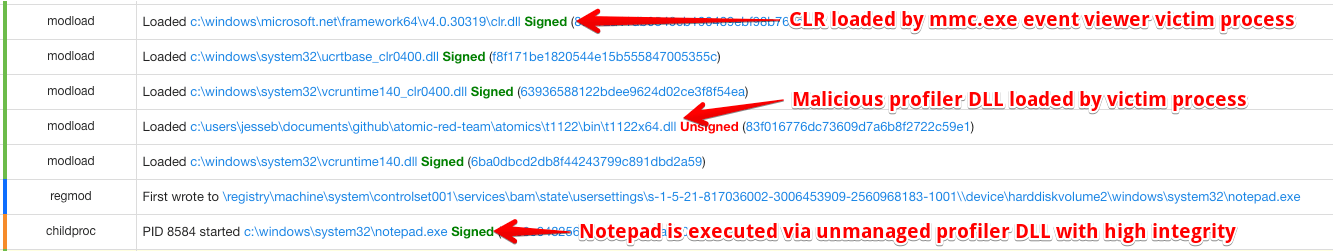
Investigation should focus on the malicious profiler DLL written to disk and loading shortly after the CLR (clr.dll) is loaded in the victim processes. The telemetry presented below shows our Atomic Red Team T1122 tests loading the unmanaged DLL payload into mmc.exe and executing the legitimate notepad.exe as a child process. If system or user scope COR_PROFILER are leveraged and run with an administrative account, this technique will also bypass UAC.
Again, any arbitrary CLSID COM interface (GUID) can be specified. With .NET Framework 4, the COM interface does not need to exist as long as the COR_PROFILER_PATH environment variable points to the location of the profiling DLL on disk.
In our research, leveraging wmic.exe to modify the COR_PROFILER environment variables has been directly associated with adversary activity. Some legitimate developer debugging tools, like Ncover or AppDynamics, may read or delete the COR_PROFILER registry keys, but it’s less likely you’ll see these tools repeatedly writing data into these registry keys.
Mitigations
The COR_PROFILER is a legitimate method developed by Microsoft for profiling managed applications. There doesn’t appear to be a method for disabling the feature to prevent adversaries from using for persistence. As with other techniques that abuse system features, it’s best to have a solid detection strategy.
It is possible to mitigate the UAC bypass by ensuring proper segmentation of administrative accounts. We recommend ensuring administrative accounts are not used for day-to-day operations by implementing Least-Privilege Administrative Models.
Closing thoughts
When leveraged maliciously, the COR_PROFILER can be a highly effective form of persistence that has the added benefit of bypassing UAC. This technique can also bypass AppLocker as DLL enforcement is not typically enabled by default. Defenders can audit the Registry keys associated with the COR_PROFILER and create high signal-to-noise methods for detection.
If you’ve seen the COR_PROFILER leveraged for persistence, bypassing UAC, or in other ways, please reach out—we would love to hear from you. You can also join the Atomic Red Team Slack and share your thoughts, improvements, and questions about the COR_PROFILER tests.
Related Articles
Train, triage, repeat: The AI agent changing how we fight phishing
The dual-use dilemma: Rethinking detection for remote access tool abuse
The dual-use dilemma: Rethinking detection for remote access tool abuse
Investigating suspicious AI workflows in Microsoft Entra Agent ID: Assistive agents