At Red Canary, we are huge believers in sharing methodologies of how and why we do things. It provides opportunities for others to learn and pushes the community forward. Today we are excited to pull back the curtains on Red Canary’s detection engineering team.
Our team’s mission is simple: hunt and find threats. Rather than analyzing and triaging alerts like a traditional Security Operations Center (SOC), we apply engineering concepts to develop detectors, tools, and systems that enable us to quickly and efficiently identify threats in massive amounts of data.
This article will be broken into 3 parts:
- Part 1: Holistic dive into our threat detection methodology and what we call “detectors”
- Part 2: Detector development using an example ATT&CK technique
- Part 3: How we turn a conceptual idea into an operational detector
I’ll wrap things up with a sneak peek of where we’re going over the next year as we continue to improve.
Part 1: Threat Detection Methodology
One of the biggest challenges for today’s security teams is keeping up with modern adversaries. Red Canary’s detection engineering team works alongside our applied research team to continuously improve detection coverage based on evolving adversarial techniques. We develop automated detectors to help our team process massive amounts of data while improving timeliness, efficiency, and detection coverage.
We define a “detector” as codified process behavior using our internal DSL. Every detector is designed around key features that help drive towards identifying interesting behavior we want analysts to review. Since every event is reviewed by an analyst, we must take into careful consideration landing on the sweet spot between a measure of specific and generalized behavior.
To take a deeper dive, watch an on-demand webinar with CEO Brian Beyer: Opening the Floodgates: How to Analyze 30+ TB of Endpoint Data Without Drowning Your Security Team
4 things to know about detectors:
1: A detector’s purpose is to identify “interesting” events.
Red Canary’s detectors are used to identify “interesting” events, not just threats. We want to cast a wide detection net, and we embrace false positives. This approach is key in covering classes of threat activity, not just singular techniques. We leverage multiple sources for identification of interesting events for coverage such as the MITRE ATT&CK framework, applied research, whitepapers, and community blogs.
2: Detectors are based on the state and activity of processes executed by users on endpoints.
Endpoint detection criteria is derived from the activity of running processes, and may include combinations or singular events. Some of the criteria we leverage includes parent-child process relationships, command line references, connection activity, interprocess communication, registry or file I/O, and many other attributes.
3: The “sweet spot” is not too specific, not too general.
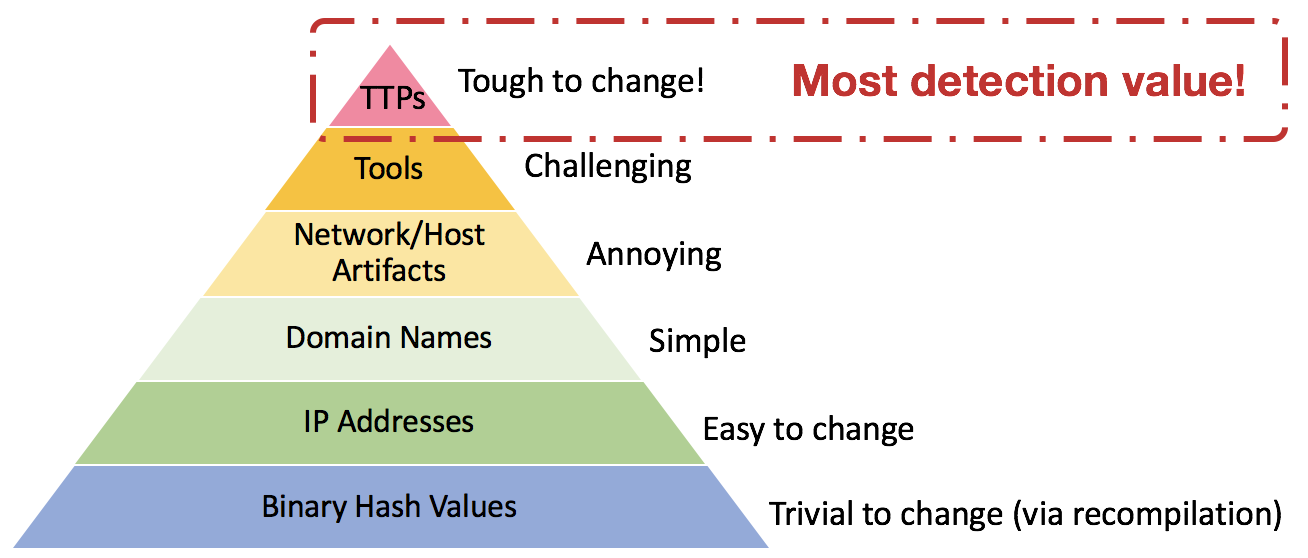
The ideal detector describes a specific, yet abstract set of behaviors that an adversary is using. In David Bianco’s Pyramid of Pain diagram, we are focused on identifying the adversary’s tactics, techniques, and procedures (TTPs). This allows us to develop a generalized detector designed to look for the abstracted behavior.
As a side note, a separate Red Canary detection process identifies the artifacts, domains, IPs, and hashes an adversary may use. Those lower sections of the pyramid provide less value than identifying TTPs, but there’s no reason to ignore easy wins when the adversary does not change atomic or computed indicators between campaigns.
4: A high false positive rate is embraced.
A consequence of generalized detection behavior is the higher rate of false positives versus atomic indicators or more specific behavioral TTPs. At Red Canary, we leverage a suppression component in our pipeline that allows analysts to prevent future events from impacting detection. The key here is, an analyst determines the event is benign, and applies appropriate suppression logic for future events.
When embracing false positives, it’s extremely important to track metrics related to conversion from true positive events to true positive malicious or suspicious detections. This enables efficient tuning and helps us identify areas where a detector is accurate at highlighting behavior, but may not produce actual threats.
To take a deep dive into our tuning methodologies, read the article: Driving Efficacy Through Detector Tuning
Part 2: Setting the Stage with ATT&CK Technique T1127: Trusted Developer Utilities
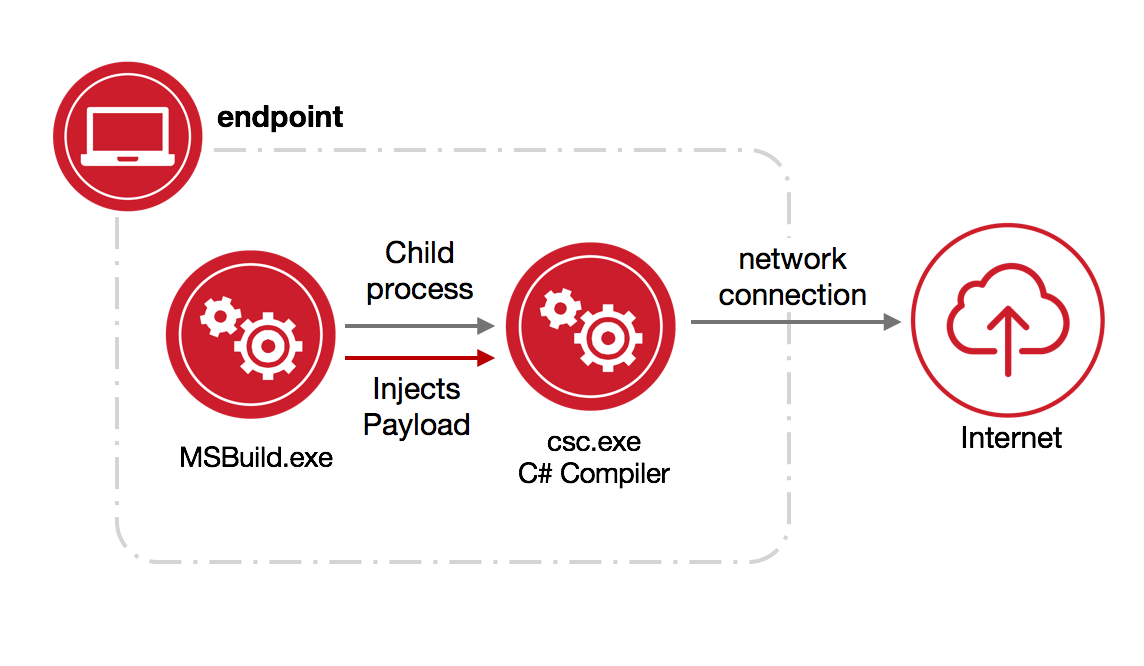
We will use an MSBuild.exe technique published by Casey Smith as an example for the remainder of this article. The technique is detailed by the following diagram:

- What is
MSBuild.exe? - How often does
MSBuild.exeexecute? - How is
MSBuild.exenormally leveraged? - What does
MSBuild.exeexecution typically look like? - Does
MSBuild.exespawn children? - If so what are the common child processes?
- What do the child processes of
MSBuild.exetypically do? - Does
MSBuild.exemake network connections? - What parent processes are common for
MSBuild.exe?
Using these questions as guides, we can begin to extrapolate behavior regarding execution of MSBuild.exe. Notice we have removed malicious execution from our line of questioning; as we want to bubble up interesting behavior that is designed to catch abnormalities, and not all will be malicious. Using our questions about MSBuild.exe, the key player in the technique, we can focus on potential behavioral detectors to identify interesting activity.
MSBuild.exespawning child processes which communicate over the network (Internal/External)MSBuild.exeprocesses with few command line parametersMSBuild.exeprocesses with no command line parametersMSBuild.exespawning from abnormal parent processes
Part 3: How to Turn a Conceptual Idea into an Operational Detector
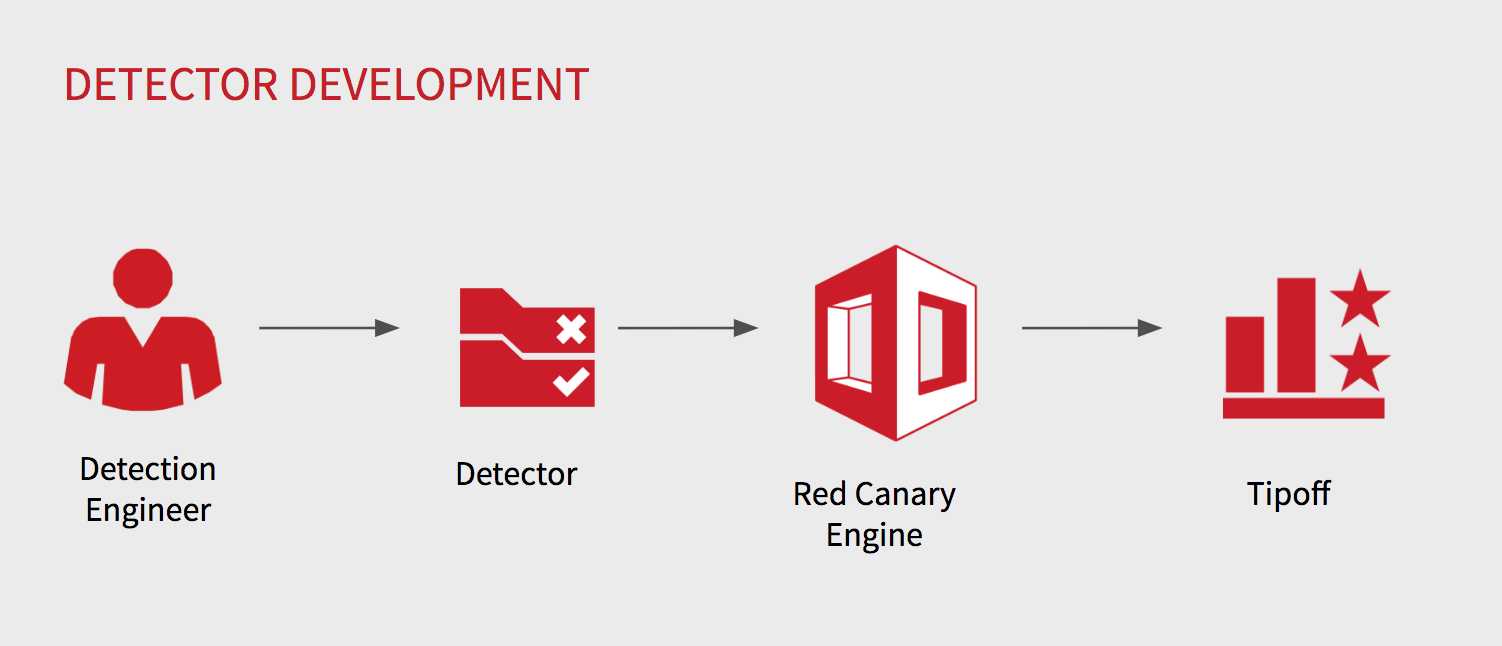
We’ve designed a process that allows our security analysts to quickly hypothesize an adversary’s TTP, design a detector, test it, and publish it to production. In some cases, this process can be run from beginning to end in less than 15 minutes.
This process is guided by a key principle: Detectors as Code. We believe there is a huge risk when your detector rules aren’t version controlled, peer reviewed, and are completely untested. We patterned this process after the battle-tested software development lifecycle, including the most important part: testing!
Let’s walk through the basic steps in this process:
Step 1: Analyst has a hypothesis about detection of a TTP.
From the technique described previously, let’s hypothesize that csc.exe, the child of MSBuild.exe, does not typically communicate over the network. We have broadened our hypothesis to be generic by removing the parent-child relationship; we will return to this shortly.
Step 2: Profile normal behavior.
Before writing our detector and associated test cases, we typically will use research from questions about the technique and ask additional questions of our dataset. In this specific example, I wanted to know a few key answers:
- Does
csc.exeever make network connections? - How often does
MSBuild.exelaunchcsc.exe? - What is
csc.exe(if I do not know)?
Our detection hypothesis is: csc.exe does not typically communicate on the network. After doing some quick queries across our data corpus, we discover that csc.exe occasionally communicates internally, to localhost, but not externally. We have a large dataset across multiple industries and organizations of varying sizes; thus, we can reasonably conclude that a detector for this will not generate many false positives. When it does fire, it will be highly suspect. If research shows potential for a high false positive rate event for our suppression engine, then the detection behavior needs to become more specific. For this example, we could re-apply the parent-child relationship criteria.
Step 3: Using the TTP, write the detector.
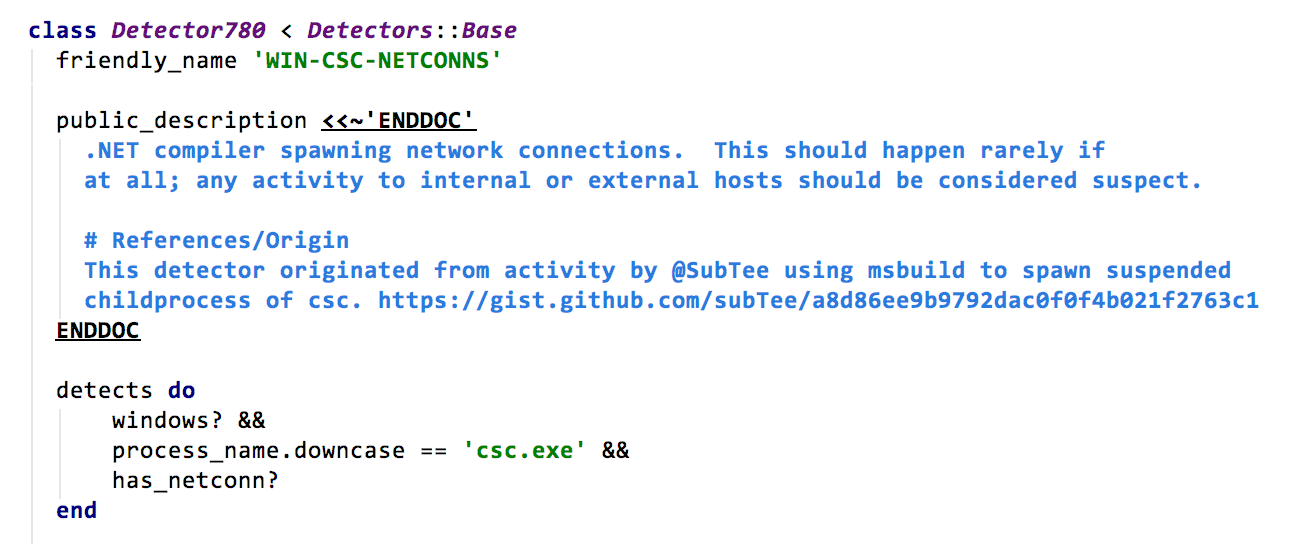
Now we’re ready to write the detector. These are Ruby classes that use the Red Canary Domain Specific Language (“DSL”) to identify process state changes and behavior. A variety of metadata describes the name, description, and additional context that will help analysts when reviewing events identified by this detector.
 Step 4: TEST!
Think about the cases that should trigger the detector, but also test cases that should not trigger the detector. This is an important way to ensure the detector does not incorrectly flag the wrong activity.
Step 5: Peer review and publish.
Finally, we submit our detector for a final peer review where it is eventually merged into production and synced with the detection engine.
Following final sync to the Red Canary platform, we will execute a series of functional tests on virtual machines whenever possible. This will allow us to confirm that detection of the techniques we set out to capture generate an event.
Looking to the Future
Our methodology and detector development lifecycle lays an important foundation as we drive toward goals for a streamlined development workflow and automated functional testing. Over the next year, we plan to link our detector development capability with a functional testing framework. This will enable us to leverage our open source Atomic Red Team tests with ATT&CK and confirm detectors operate as intended at any given time. We envision this connection to drive continuous confirmation of existing coverage and identify priority for future development efforts.
Other areas we have on our radar for exploration include:
- Detectors dependent upon one another
- Detectors leveraging heuristic techniques
- Response and outbreak automation
In the next article in this series, we dive deeper into our tuning methodologies, focusing on how we measure detector quality, avoid the pitfalls of embracing high false positives, and strive to improve coverage without generating toil for our analysts.
To take a deeper dive, watch an on-demand webinar with CEO Brian Beyer: Opening the Floodgates: How to Analyze 30+ TB of Endpoint Data Without Drowning Your Security Team
 To take a deeper dive, watch an on-demand webinar with CEO Brian Beyer:
 Step 4: TEST!