
Red Canary processes a lot of data. On average, we process about 1 petabyte (which is 1,000 terabytes, or 1,000,000 gigabytes, or 772 million floppy disks) of incoming security telemetry per day. That incoming telemetry isn’t steady throughout the day—it rises and falls as our customers log on to their computers and go home for the day, so we need to ensure that our system can scale up and down throughout the day to handle this changing data rate in a cost-effective way.
Start your engines
The Red Canary Detection Engine, which processes all that incoming telemetry, is broken up into several different components, each of which has a different job to do with the incoming telemetry. These components include:
- a standardizer that normalizes incoming data into a format that’s consistent across Red Canary
- a term evaluator that evaluates “terms” within our detection engine as a precursor to firing off behavioral detections into incoming telemetry
- a detector evaluator that compares the terms in the telemetry against a set of behavioral patterns that may indicate a threat
To handle the volume of incoming data, we need thousands of instances of each of these components and others, running across hundreds of computers running in the cloud. This is a lot of complexity to manage, so we use Kubernetes to help us out.
Glossary
Before we dive too far down into the weeds, here’s a quick sidebar to explain some terminology that’s common when talking about Kubernetes.
Let’s start with a node: a node is just a fancy name for a computer. It’s most likely a computer that’s running in the cloud somewhere like Amazon Web Services (AWS) or Microsoft Azure, but it doesn’t have to be. It can be physical or virtual—it doesn’t really matter. It’s just a computer.
Next, we have a cluster: a cluster is a set of nodes (computers) that are managed by Kubernetes.
Last, we have pods: pods are applications that do work within the cluster. If you’re familiar with concepts like Docker containers, a pod is just a grouping of one or more containers. A pod is the smallest “unit of work” that a Kubernetes cluster manages.
When a new pod is scheduled to run within a Kubernetes cluster, the Kubernetes control plane (which manages the entire cluster, all of the nodes, and where the pods are executed on those nodes) decides which node has enough spare capacity to handle the request and starts running the pod on that specific node.
There’s a lot of abstraction going on here and it’s sometimes helpful to think about it in terms of a metaphor. Let’s pretend that the company you work for is Kubernetes—that would make you and your co-workers nodes and the jobs that you do pods. If your boss (the Kubernetes control plane) has more work that needs to get done than employees available (more pods to schedule than nodes available), your boss will hire more employees. In Kubernetes, this concept is handled via a cluster autoscaler, which will automatically request more nodes if there is more work to do than computers available in the cluster.
Kubernetes is kind of like a landlord who starts building a new building during the process of filling up an old one, so he can keep adding tenants without interruption.
How Red Canary uses Kubernetes
With those basic concepts behind us, let’s jump back to our challenge. Red Canary automatically scales up our detection engine by adding more pods whenever the queue feeding the engine starts to get too long. Kubernetes lets us manage this independently of the underlying computer infrastructure upon which we run. Once Kubernetes has exhausted the amount of computing horsepower in the cluster, it can go back to AWS and request more nodes via the cluster autoscaler. It’s kind of like a landlord who starts building a new building during the process of filling up an old one, so he can keep adding tenants without interruption.
On average, our Kubernetes cluster grows by about 300 nodes (computers) per day, adding about 20,000 CPUs—the equivalent of 3,300 MacBook Pros—during peak traffic. It contracts back down in the evening once the data volume tapers off. Every so often, if our engine fell behind in data processing, we’d have to “floor it” to make the engine go faster by throwing even more computers at it, occasionally surging even more than 300 nodes.
The Kubernetes control plane handles requests to run more (or less) of a specific engine component, and starts to run these components onto wherever spare nodes are available in the cluster. This is what Kubernetes is good at—handling the complex orchestration for you so you can focus on writing other software that does cool things.
Well, that’s the idea, anyway.
Here’s where it gets complicated
There’s a big catch to all of this: it’s complex. Running applications in the cloud is complicated. Running applications inside of containers is even more complicated. Running applications in containers on the cloud adds even more complexity. Running containers in an abstracted environment where they don’t care which cloud computer they’re running on is really really complicated; and that’s what Kubernetes does.
In the early days, Kubernetes was exceptionally hard to set up and configure. Any piece of software this complicated will likely be hard to get set up. While this setup and configuration can now be automated through the use of managed tools, early adopters of Kubernetes (like Red Canary) had to configure their own clusters (often by trial and error… lots of error). So our primary production Kubernetes cluster, Purple (we tended to call things by colors for a while, and Purple was the successor to our first two clusters, Blue and Red), was artisanally crafted over the course of many years, which means that less of it was captured in our configuration baseline than should have been, and it was woefully out of date in terms of the Kubernetes version it was running. This isn’t exactly a great position to be in for the thing that’s orchestrating all of the data processing in your application.
It’s not a good idea to be running out-of-date software for many reasons, but Kubernetes was evolving (and improving) quickly, and our lack of updates meant we were falling behind some of the stabilization improvements that had become available.
But our cluster goes to 11 (except when it doesn’t)
Our Kubernetes cluster was running at about 600 nodes on average—this was enough computers to handle the nominal data rates sent in by our customers. Occasionally, however, an engine component will break. When this occurs, our engineering team quickly jumps on the issue to resolve it and deploys a fix—but then data is backlogged behind that component. We still have our steady stream of data that’s coming in, but now we have to process an additional 30 minutes of data (or however long the component was down) as fast as possible to ensure we can get detections out to customers as quickly as possible.
When this happens, we scale up all of our engine components to make them go as fast as possible. As a reaction, Kubernetes scales up the cluster size, adding more nodes to go from 600 to 800, or whatever number of computers is required to run the requested number of pods. Normally this is fine and Kubernetes does this without any drama (which is good, because usually the engineering team is focused on fixing the issue that caused the backup to begin with). But, all of a sudden, whenever we tried to ramp up quickly, our Kubernetes control plane would completely shut down.
Damage control
Let’s take a quick second to explain how Kubernetes does its job: there are worker nodes, in our case hundreds of them, that run pods (sets of containers, or the applications themselves) and a control plane, running on three or five machines, that manages everything else about Kubernetes. This separation means that if the control plane fails the rest of the cluster can keep on doing exactly what it was doing without any issue. If we go back to the landlord metaphor from before, if the landlord goes missing, the tenants can still live happily in their apartments as if everything is normal—just no one can move in or out and there’s no one around to deal with issues that may arise.
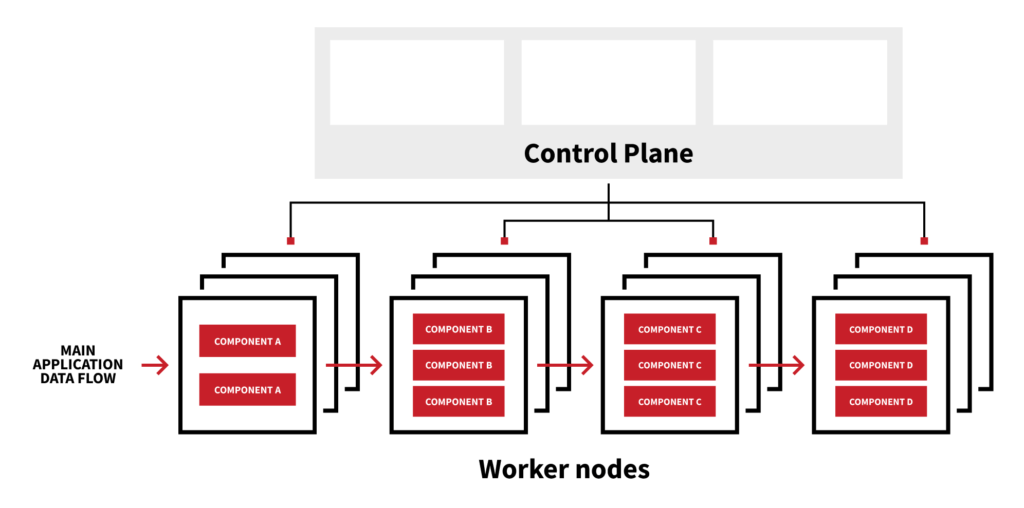
Kubernetes control plane and worker nodes
Normally a control plane failure is not particularly catastrophic as long as the cluster is doing what you want the cluster to be doing. In our case, we wanted the cluster to be getting bigger and running more engine components to work off the backlog of data. Without a control plane, we could do neither.
Now, instead of one fire (the failed engine component), we had two (a failed engine component combined with a dead control plane).

Fighting fires on two fronts is never a situation you want to be in. It takes a stressful situation and just amplifies it significantly. Our system was still processing data, but we couldn’t make it go any faster, and we didn’t know why the Kubernetes control plane was failing.
We would restart our Kubernetes control plane nodes and the control plane would come back up for a few minutes before crashing hard again and becoming unresponsive. Eventually (after many failed attempts at diagnosing this issue), we noticed in our monitoring dashboards that the Kubernetes API requests metric (which measures how much each node in the cluster is talking to the control plane) would absolutely skyrocket whenever we scaled up our cluster size. To some extent, this behavior is expected: more nodes in the cluster means more things trying to talk to the control plane all at once. But this increase in traffic seemed to scale non-linearly compared to the number of nodes being added. Additionally, the error rate on the API skyrocketed as well.
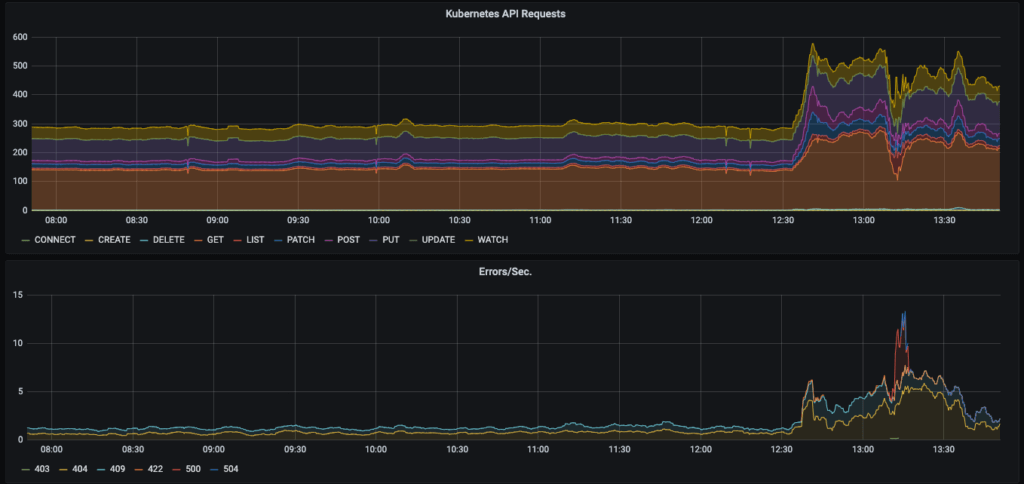
API requests skyrocket once the cluster scales up
After restarting the control plane several times and manually reducing the number of nodes in the cluster, we started to correlate that the failures seemed to be directly related to the number of nodes. It seemed that once our cluster grew beyond 900 worker nodes, the control plane would shut down with the exact same predictable behavior: all Kubernetes API requests would fail and control plane nodes would effectively become unresponsive.
Wait, what?
This didn’t make any sense! Kubernetes is supposed to support up to 5,000 nodes! Some additional digging on the internet seemed to reveal a similar experience from others—beyond 1,000 nodes the cluster tended to implode on itself. Our best theory was that etcd, a distributed key-value store that keeps track of the Kubernetes cluster state (sort of the central memory of the cluster itself) was not able to write to disk fast enough and replicate its state beyond a certain cluster size. This theory was reinforced when we observed that the etcd logs would simply stop flowing once the scale-up occurred and the Kubernetes API became dead in the water. Our analysis of the traffic coming out of the control plane nodes before it failed found that they were attempting to push 12 gigabytes per second of data during these events.
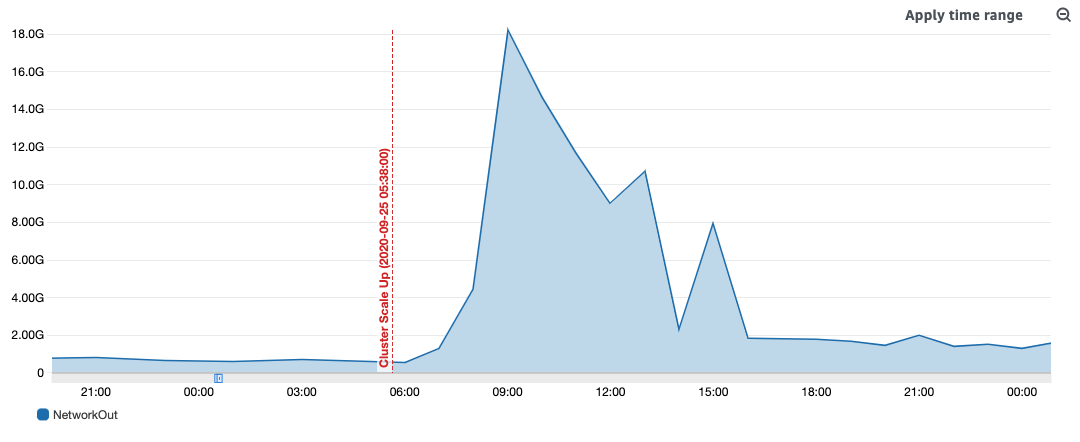
Network traffic scaling non-linearly during a scaling event
A quick fix
Once we realized that the threshold for problems was about 900 nodes in our Kubernetes cluster, that allowed us to start formulating strategies to deal with the problem. We knew we could survive an issue by frequently restarting the Kubernetes control plane, but this wasn’t a sustainable plan.
We first bought ourselves some time by capping the maximum number of pods that each engine component could scale up to. This strategy prevented them from asking for more nodes from the control plane, which would then scale up the cluster to the size at which it imploded. But this wasn’t a good solution either, since setting an upper bound on the number of engine components meant that we were effectively throttling the data rate through our engine. It’s like taking a six-lane highway and reducing it to three lanes; traffic will still get through, but at rush hour it’s just going to cause a lot of backups.
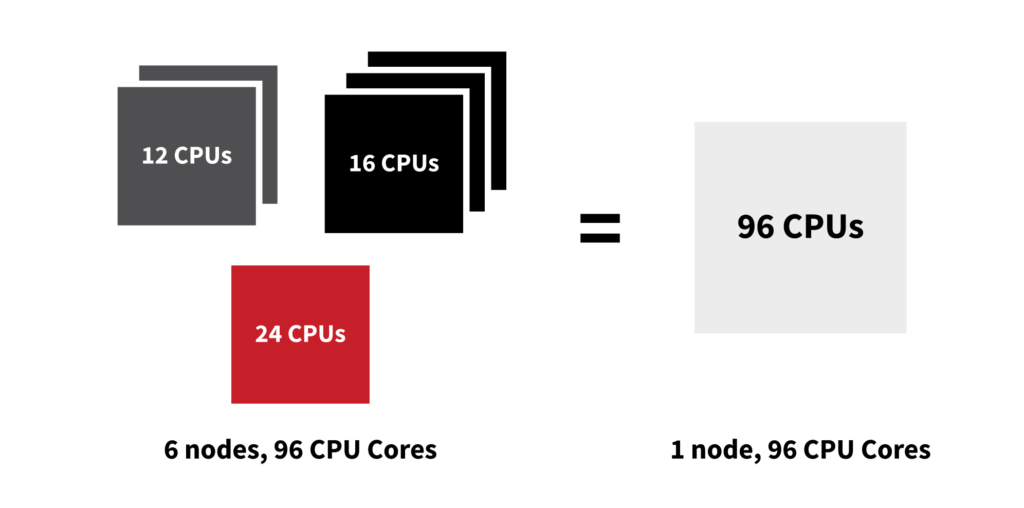
Then, our engineering team came up with a brilliant short-term solution: make the nodes bigger. From all the data that we could see, the problem occurred when we hit about 900 nodes (computers)—it had nothing to do with how much memory the cluster collectively had, or how many CPU cores were in the cluster, it was solely the number of computers that were in the cluster.

Our cluster was made up of a diverse set of computers from AWS. Some of them had 96 CPU cores (about the equivalent of 16 MacBook Pros), and some of them had 16 CPU cores (about the equivalent of 2.5 MacBook Pros). Why, you ask? Because we run on AWS Spot Instances (which is a different article altogether), and we basically take whatever leftovers AWS has available to save costs.
Don’t get picky
For spot instances, it’s advantageous to be ready to ask for a wide variety of computer types in case they’re out of the “flavor” that you’re looking for. In other words, you are more likely to come out of the ice cream store happy if you like 13 different flavors of ice cream and they happen to be out of one or two of them (you’ll still have 11 flavors that delight you) as opposed to your ever-so-picky 5 year old that only wants vanilla…if they’re out of vanilla, your 5 year old will walk away empty handed.
Back to the main story: we told our Kubernetes cluster that it liked about 25 different flavors of ice cream…or server CPU/memory configurations. Big or small, we ran the gamut just in case one wasn’t available (which occasionally happens with spot instances). But here’s the important detail: in terms of engine performance, our applications don’t really care if they run on a big or small computer. It’s a distributed application that’s designed to be fanned out across thousands of instances, and most of the engine components only require about the horsepower of one MacBook Pro to run (maybe 6 CPU cores and 8 GB of memory). On a big computer, we could run 16 instances of a component on it; on a small instance, we could run only two.
Because of this simple fact, we just needed lots of CPUs and memory—our engine doesn’t care how many computers it runs on. So, instead of asking for big and small computers from AWS, we changed our Kubernetes cluster to exclusively ask for computers that had 72 or 96 CPU cores. Yes, this increased our risk of encountering a spot instance shortage, but not dramatically since we still had a number of different instance “flavors” we could pick from in that large server size.
The change of switching to larger computers had the net effect of reducing the average number of nodes we ran on from 600 computers down to about 400 computers and gave us some temporary headroom in the cluster until we could come up with a better long-term solution.
Swapping instance sizes for fun and profit!
A lifeboat emerges
With breathing room established on the primary engine cluster, the engineering team was no longer focused on keeping the control plane running and could instead focus on a more permanent long-term solution.
Thankfully, our application is written with little regard to where it runs. Each engine component is fed via a queue that isn’t on the same network as the software that consumes it. Because of this, our engineering team realized that the best long-term solution was to break our single massive Kubernetes cluster into several smaller clusters and divide the engine pieces across each cluster. This would provide more headroom for each cluster (if they encountered the same 900-node limitation) as well as redundancy—if one control plane failed, there were other clusters that could still be working just fine and could be used in an emergency to shift the application load.

We first started by creating another hand-crafted cluster, aptly named “lifeboat,” to both test our hypothesis and provide, well, a lifeboat in case we ran into problems again. Since we are now in the modern era of managed Kubernetes (which we were not when Purple was first built), we opted to use AWS’s Elastic Kubernetes Service (EKS) to manage our Kubernetes control plane instead of attempting to build one ourselves. We found setup and configuration to be far simpler than administering our old hand-built cluster and quickly had a functioning life raft that we could jettison load onto in an emergency. And, it just so happened that one came up rather quickly.
An operational issue forced us to once again accelerate processing as fast as we could and we found ourselves close to the 900-node maximum on our primary Kubernetes cluster (even with the larger node sizes). We quickly deployed our largest (in terms of CPU usage) engine component, the term evaluator, into the new lifeboat cluster and got it working to process the incoming data. Once it was running and scaled to its needed size, we could shut off the term evaluator in the Purple Kubernetes cluster. This allowed us to scale Purple back down to 500 nodes (since the new lifeboat cluster was running with about 300 nodes). Now both clusters had ample headroom to scale.
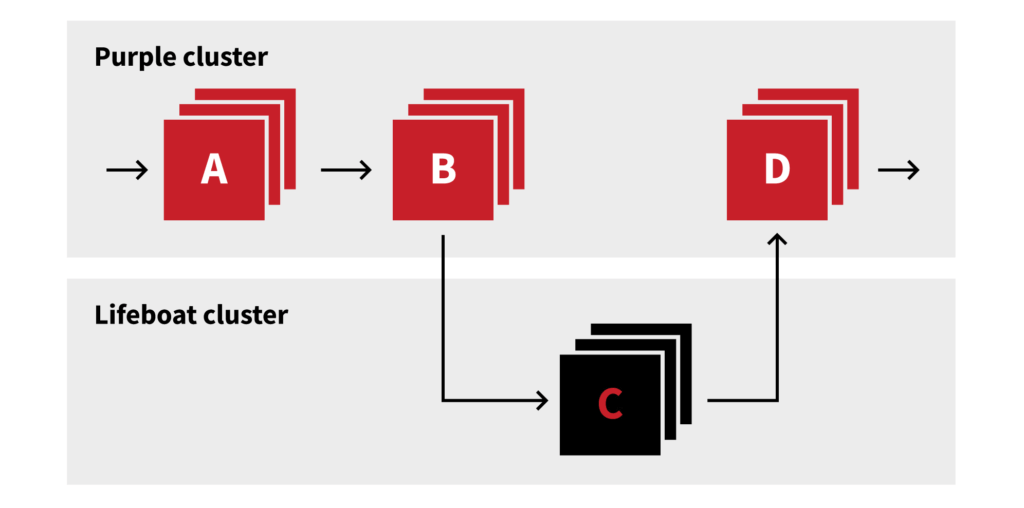
Lifeboat saves us from the storm!
Steering toward the future
With our accidental multi-cluster experiment a wild success, we began to formalize the long-term plan. We took the lifeboat cluster and formalized its configuration into our Terraform Infrastructure as code baseline (yes, we capture all of our infrastructure as code now, and have for some time… we just didn’t when we built Purple long ago) and have now stood up five different AWS EKS clusters. This cluster definition as code has been tremendously advantageous as we’ve already had to tear them down and rebuild them several times since we initially created them due to unexpected technical hurdles (like running out of IP address space, correctly configuring the networking across them, etc.).
But we’re not done yet—it turns out that there are a lot of embedded assumptions about our runtime environment throughout our entire codebase. It’s never quite as simple as picking up your code and dropping it somewhere else (just like it’s never quite as simple to move from one house to another, especially if you’ve been in there for a long time). We continue to work through the challenges of migrating out of our Purple cluster and into our fancy new clusters (all while still processing a petabyte of data per day).
We’re not at our end-state objective yet, but our work has all but eliminated operational incidents surrounding our Purple Kubernetes cluster and allowed us time to stabilize and brace other parts of Red Canary that are facing similar challenges due to our fantastic growth.
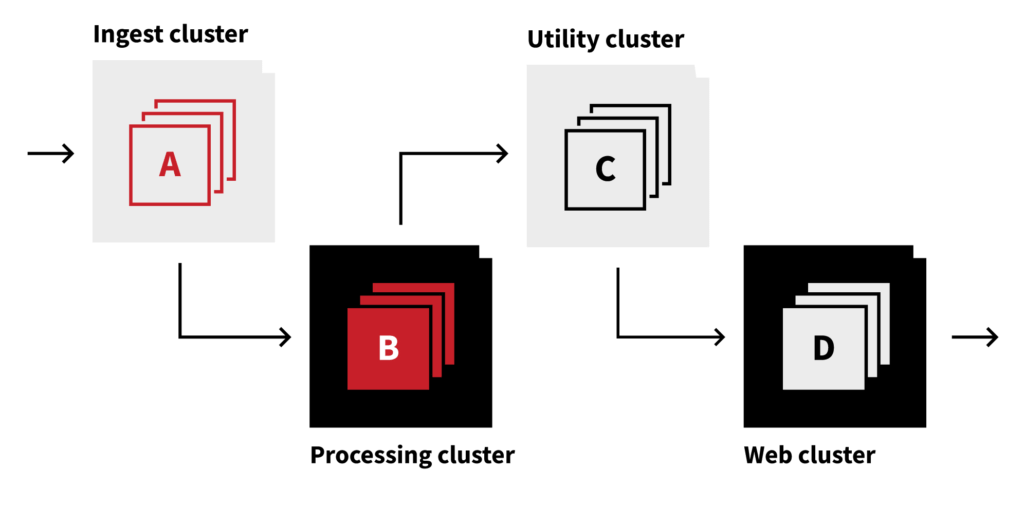
Our endstate cluster vision
Related Articles
The dual-use dilemma: Rethinking detection for remote access tool abuse