
One of the main things that drew me to work for Red Canary was a strong sense of practicality. Having worked in cybersecurity for over a decade, I’m used to hearing companies talk about finding a shiny new APT or a sexy new vulnerability/exploit. However, when I first looked into Red Canary, I stumbled upon this video that instead focused on something refreshingly different: how do you build a massively scalable detection engine?
In the video, CEO Brian Beyer shares the quote, “A high quality complex system is made up of many simple systems.” While his focus is on engineering the building blocks of our detection engine, it reflects a larger ethos that really resonated with me. Before you can do something difficult and complicated, you have to do the basics really well and really consistently. Sure, there are intrusions out there resulting from esoteric zero days and crazy stealthy adversaries, but how often are they a result of an adversary using the same tried-and-true techniques that are just hard to detect consistently?
One of the ways Red Canary approaches this challenge is through our Detection Validation team. Outside of people writing code or detection analytics, it is critical to have another perspective looking at the full end-to-end of how malicious activity turns into a threat published to our customers and ask the question: Does everything work as expected? In the past, most of our validation work has been performed ad hoc by a few brave Canaries who have stepped up to the challenge, but that’s not a great model to sustain or scale these efforts. To properly address these challenges, we have spent much of the last year formalizing our approach to validation.
To share these efforts, we wanted to kick off a new blog series dubbed “The Validated Canary.” In the future, this series will feature some technical deep dives into topics that will hopefully be of interest not just to folks doing validation but to anyone trying to find evil. However, this initial blog post focuses on Red Canary’s overall approach to validation to provide the context for our followup work.
When it comes to approaching a problem like validation, context is everything.
The Detection Validation team
Like any organization, Red Canary is composed of a variety of work roles. On the more technical side, those roles include software engineers writing code, detection engineers writing detection analytics and triaging potential threats, and intel analysts tracking tools and threat actors. The challenge is verifying that the work of many talented specialists with different skill sets produces the overall result we set out to achieve. A classic approach is to just hope that enough individuals step up, though this has limitations and doesn’t scale well.
Red Canary has improved our approach to this problem by establishing a formal Detection Validation team of individuals with multidisciplinary skill sets. We’re part cybersecurity professionals and part software engineers with a mix of both offensive and defensive backgrounds, and our full-time jobs are to focus on the full end-to-end of Red Canary’s platform. These skills mixed with this perspective enables us to help bridge the gap between different work roles.
The Detection Validation team is responsible for both identifying AND resolving problems. We aren’t just running tests and telling people when they failed. If something isn’t working, we dig in to understand how an individual component works, determine why it’s not behaving as expected, and either fix the code ourselves or work with another team to resolve the problem.
In addition to our perspective, it’s also critical that we have the bandwidth to properly analyze what’s going on. Our software engineers are busy turning out code to deliver new awesome features. Our detection engineers are focused on catching threats in our customer environments. Sometimes, it’s just useful to have a friend looking over your shoulder to make sure you don’t make any mistakes or make changes that have unexpected consequences.
The Detection Validation team has limited people resources to validate tens of thousands of places where our integrations interact with our detection engine, so a key component of our efforts is how to accomplish these goals at scale.
How does Red Canary work?
How does the Detection Validation team verify that everything works as expected? Before we can answer that question, we have to actually understand how everything is supposed to work. If you’ll bear with me, I want to start from the very beginning, and the first piece of that puzzle is telemetry.
Telemetry
What is it?
The foundation of Red Canary’s platform is telemetry, and since everything that follows builds off of this concept, I wanted to start with a brief explanation of what it is and why it’s useful. Telemetry is a series of individual records that represents the behavior of a computer system. Someone logged in. A process was started. A file was created. Each action is represented by a record (typically JSON), and each record contains specific fields to indicate what the actions were. For instance, if someone ran the command whoami on Windows, a telemetry record would be generated with information such as:
{
  "event_type": "process_start",
  "process_command_line": "whoami",
  "process_md5": "43c2d3293ad939241df61b3630a9d3b6",
  "process_name":"whoami.exe",
  "process_path": "C:\Windows\System32\whoami.exe",
  "process_pid": 1528,
  "process_started_at_ts": "2023-03-15T09:35:33.000Z"
}
In this example, the event type indicates what type of behavior was captured (process start, file creation, etc.), and the other fields provide the specifics of that behavior (the process that started is called whoami.exe, the path to the executable is C:\Windows\System32\whoami.exe, etc.).
By analyzing these telemetry records, you can determine whether the actions taken on a computer system are malicious.
Where does it come from?
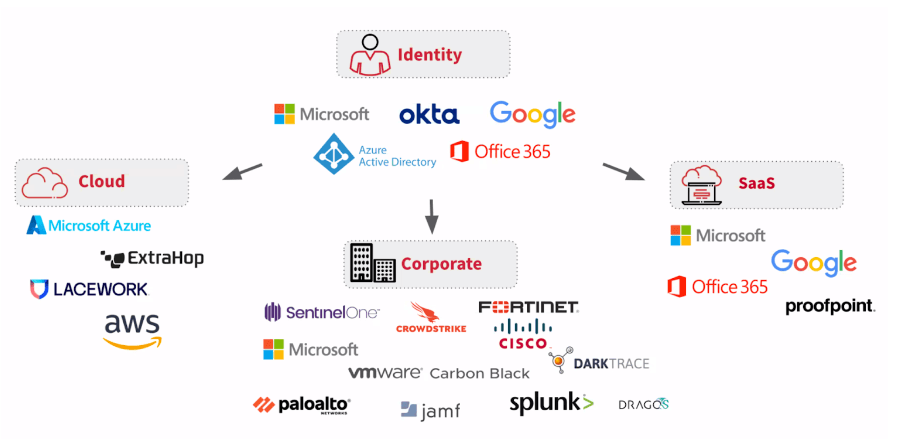
Something that distinguishes Red Canary in the Managed Detection and Response (MDR) space is that we work with telemetry from a number of sources. Traditionally, we’ve focused on endpoints, and we ingest telemetry from Endpoint Detection and Response (EDR) sensors such as CrowdStrike Falcon, Microsoft Defender for Endpoint, and VMWare Carbon Black Cloud running on Windows, Linux, and macOS. However, we also ingest telemetry from additional sources such as cloud providers and SaaS applications.
The fact that Red Canary works with a large number of telemetry sources is a challenge because we have to understand each source and translate it into something our detection engine understands. It also means that we have a unique perspective in comparing, contrasting, and validating the telemetry generated by all of these different sources. For the Detection Validation team, our efforts are, in part, defined by the scope of this problem.
Red Canary’s platform
Next is a brief overview of how Red Canary works. If you want a proper deep dive, go watch the video I mentioned before, but if you want to save the 40+ minutes, the following includes the details relevant to this discussion.
AWS
Red Canary’s platform runs in Amazon Web Services (AWS). Most of the details aren’t important for this blog, but it’s worth noting that at every step of processing telemetry, we store our engine data in S3 buckets (AWS filestores). If we want to understand the state of the engine at a certain point, we just have to look at the correct S3 bucket.
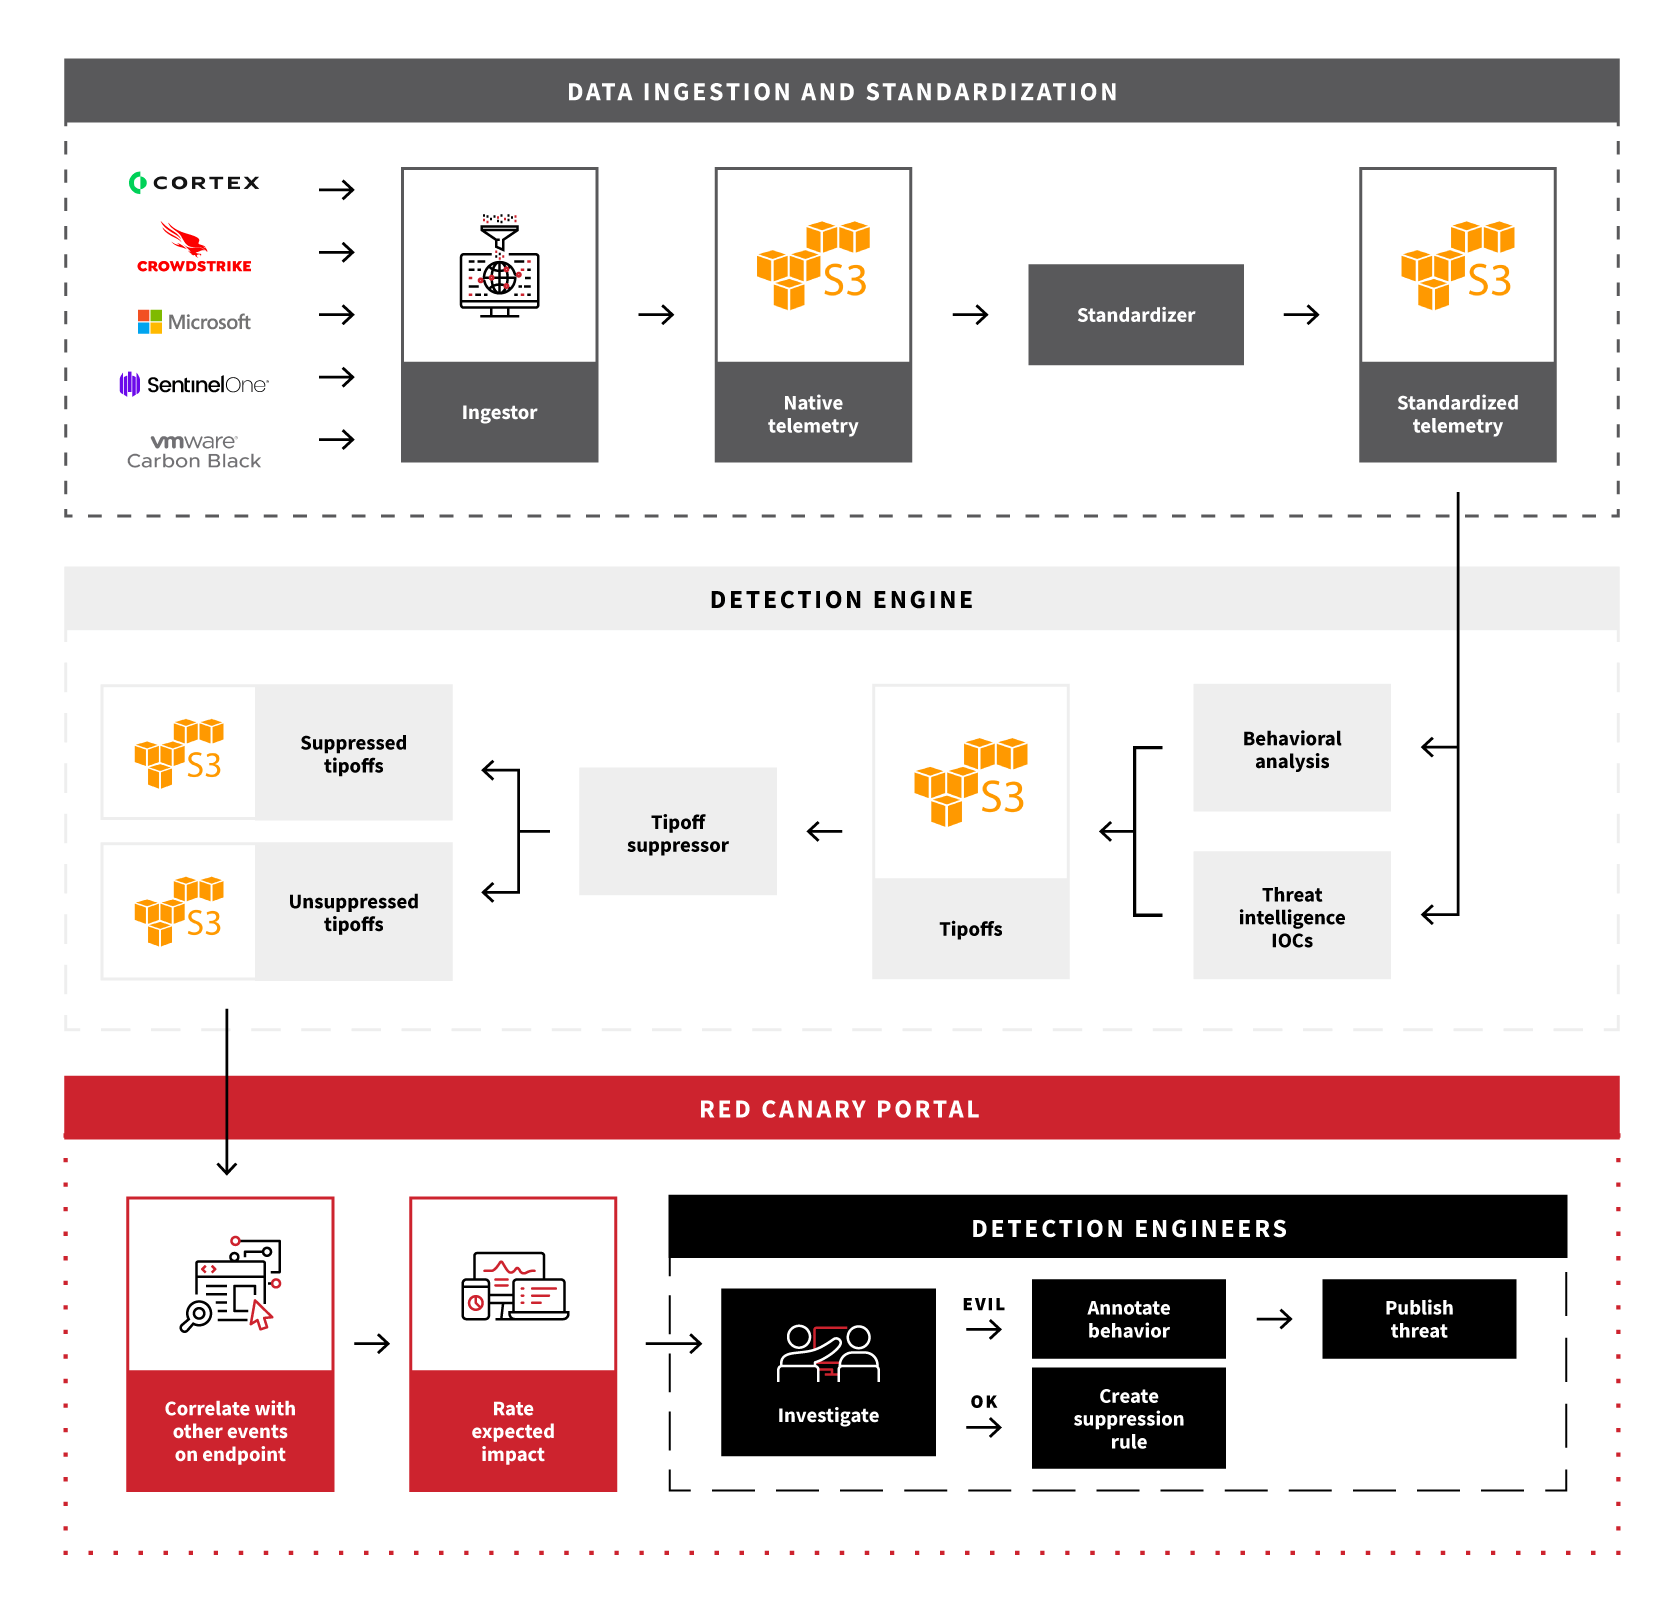
Data ingestion and standardization
The first step is to ingest the native telemetry—the original records provided by a telemetry source—and store it in an S3 bucket. Since every telemetry source uses a different data structure, we then have to standardize native telemetry into data structures that Red Canary’s engine can understand. In practice, that process mostly consists of relabeling fields (i.e., tgt.process.path -> process_path), but depending on the nuances of the telemetry, it can get much more complicated. The resulting standardized telemetry is put into another S3 bucket where it’s then fed into the detection engine.
Detection engine
The detection engine consumes standardized telemetry, parses it against our library of custom detection analytics, and produces tipoffs which alert our detection engineering team of potentially suspicious/malicious activity. At a (very) high level, the detection engine is doing two things:
- Establishing a clear picture of process behavior by correlating individual telemetry records and maintaining the state of each process. For instance, if a process establishes a network connection to download a file, writes the file to disk, and then executes it, we need to tie the individual records together to accurately represent the overarching behavior.
- Determining if the overarching behavior matches a detection analytic or some known indicator of compromise (IOC) such as a file being written with a known bad hash.
Once a tipoff fires, it passes through our tipoff suppressor to determine if it should be analyzed. The tipoff suppressor is constantly tuned by detection engineers so that once a false positive is triaged and identified, similar false positives won’t require repetitive manual analysis moving forward.
Red Canary Portal
All tipoffs that make it through the tipoff suppressor feed into the Red Canary Portal. Here, they are correlated with other relevant events to provide the full context of the potentially malicious behavior and sent to a detection engineer for analysis. If the tipoff is a false positive, the detection engineer generates a suppression rule. If it’s actually malicious, they annotate the behavior to clearly explain what happened and send this information to the customer in a detailed threat detection timeline. For certain known threats, we have “Autobots” that skip the detection engineer and automatically annotate and ship them.
How do we validate Red Canary?
Alright, now that we understand the basics of Red Canary’s platform, how do we validate that everything’s working as expected? Validation is tricky because there are thousands of places where things can go wrong, and no matter how particular you are, there is always room to be even more thorough. Based on the size of our team and the scope of validating the Red Canary platform, the following is how we chose to approach this problem.
End-to-end functional testing
Our Detection Validation team focuses on end-to-end functional testing. No matter how thoroughly individual components are tested, the thing we care about is whether they all work together.
The first step we took towards end-to-end functional testing was to take the simplest approach possible: treat the entire platform like a black box. If we detonate a thing on an endpoint, did the expected tipoff(s) fire and show up in the portal? If so, then everything works. If not, all we know is that something is broken, but we have a clear signal that we need to go digging.
In addition to just detonating more/different things, we improve test coverage by stressing the internal logic. Using a previous example behavior, if we design a detector to fire when a specific process establishes a network connection to a specific domain to download a file, writes the file to disk in a specific path, and then executes it, a test that causes this single detector to fire means:
- We are successfully ingesting/standardizing multiple types of telemetry (process, network, and file)
- The detection engine is successfully correlating all of those telemetry records
For these tests, we use a combination of Atomic Red Team, Atomic Test Harnesses, and an internal testing framework called Vuvuzela. A deceptively simple yet powerful thing that Vuvuzela does is both run a test and report what the results should be (i.e., we should trigger detector 1234), and that will come in handy later.
Choke points
The next step was to improve fidelity by focusing on key choke points in Red Canary’s engine:
- Native telemetry: Did the source actually send us the telemetry?
- Standardized telemetry: Did we successfully standardize the telemetry so the engine can see the data?
- Tipoffs: Did the tipoff even fire so it could hit our analysis workflows?
At this level, validating tipoffs is pretty much the same (it’s just a little earlier in the pipeline), but looking at standardized telemetry adds both new complexity and new value. Instead of simply looking for a specific detector that fired, we inspect the standardized telemetry field by field to verify that the telemetry generated by a test is exactly what we expect it to be. Now, we’ve expanded our test coverage to not just include malicious activity but also include mundane activity that should still result in telemetry.
To validate standardized telemetry, we once again turn to Vuvuzela, which was designed for this specific task. In addition to reporting detectors that should fire based on a given test, it also reports the telemetry we should see, down to every individual field. For instance, Vuvuzela (written in Python) will start a process and then inspect that process to grab the executable name, parent PID, PID, and command line using methods like:
proc = psutil.Popen(process_creation_arguments)
psutil_proc_exe  = proc.exe()
psutil_proc_ppid = proc.ppid()
psutil_proc_pid  = proc.pid
psutil_proc_args = proc.argsBy consistently getting the ground truth of what actually happened, we can compare that to the standardized telemetry to verify that everything looks correct. If there are any problems or we can’t identify the expected standardized telemetry, we then look at the native telemetry to determine if we got the data at all.
What happens when we just don’t get the data?
One of the challenges of validating telemetry is that no telemetry source is ever exhaustive. Generating and processing telemetry involves engineering tradeoffs such as:
- Signal vs. noise: How do you maximize the telemetry indicating malicious behavior (signal) and minimize the telemetry indicating benign behavior (noise) without missing anything?
- Performance/cost: Sensors need to minimize their system load so they don’t degrade a computer’s performance, and processing/storing data costs money. Customer computers need to run efficiently, and cybersecurity companies need to avoid going broke processing/storing a bunch of useless data.
What does that mean for validation? It’s our team’s job to validate that telemetry sources provide successful coverage and to work with our partners to make adjustments as threats evolve. The need to make these adjustments is also why we find it important to supplement testing of adversary tradecraft with tests of benign behaviors. We want to make sure that we aren’t missing any telemetry when we need it the most.
Results of this approach
By taking this approach to validation, we have been able to identify and fix a number of issues. Typically, this validation is most useful when making large changes like integrating a new telemetry source or modifying major components of our engine. However, periodic validation is also important to determine potential downstream impacts of changes like endpoint sensor upgrades.
Here are some of the issues we’ve been able to catch:
- Some telemetry was collected by partner sensors but not forwarded to Red Canary’s engine
- Portal data from a telemetry source was not properly correlating for individual endpoints
- Useful data from a telemetry source was not being displayed in Red Canary’s portal
- A new release of an endpoint sensor started reporting hash values that were clearly not hashes
- A new release of an endpoint sensor generated process start records that presented the grandparent PID as the parent PID
- The artificial nature of a validation testing setup caused unexpected sensor behavior
Yes, we have even used our validation process to validate itself. Some of these issues were fairly obvious while others were rather subtle. To be honest, none of these results are super flashy, but that’s kind of the point. Our goal is to do the basics really well and really consistently. Before Red Canary’s awesome detection engineers and analytics can catch threats, we have to make sure our platform is reliably ingesting and displaying telemetry.
Up next: Automated validation
A core tenant at Red Canary is creating technology that scales. That’s how we take absurd amounts of telemetry from all of our customers and distill it down into clear signals that can be triaged by our detection engineers. All of the validation concepts above are great, but if they’re done manually, it’s a lot of work and only validates that everything is working at that exact time. To properly validate at scale, we had to automate these processes.
How did we automate these processes? You’ll have to find out next time on The Validated Canary! Same Canary-Time, same Canary-Channel.