
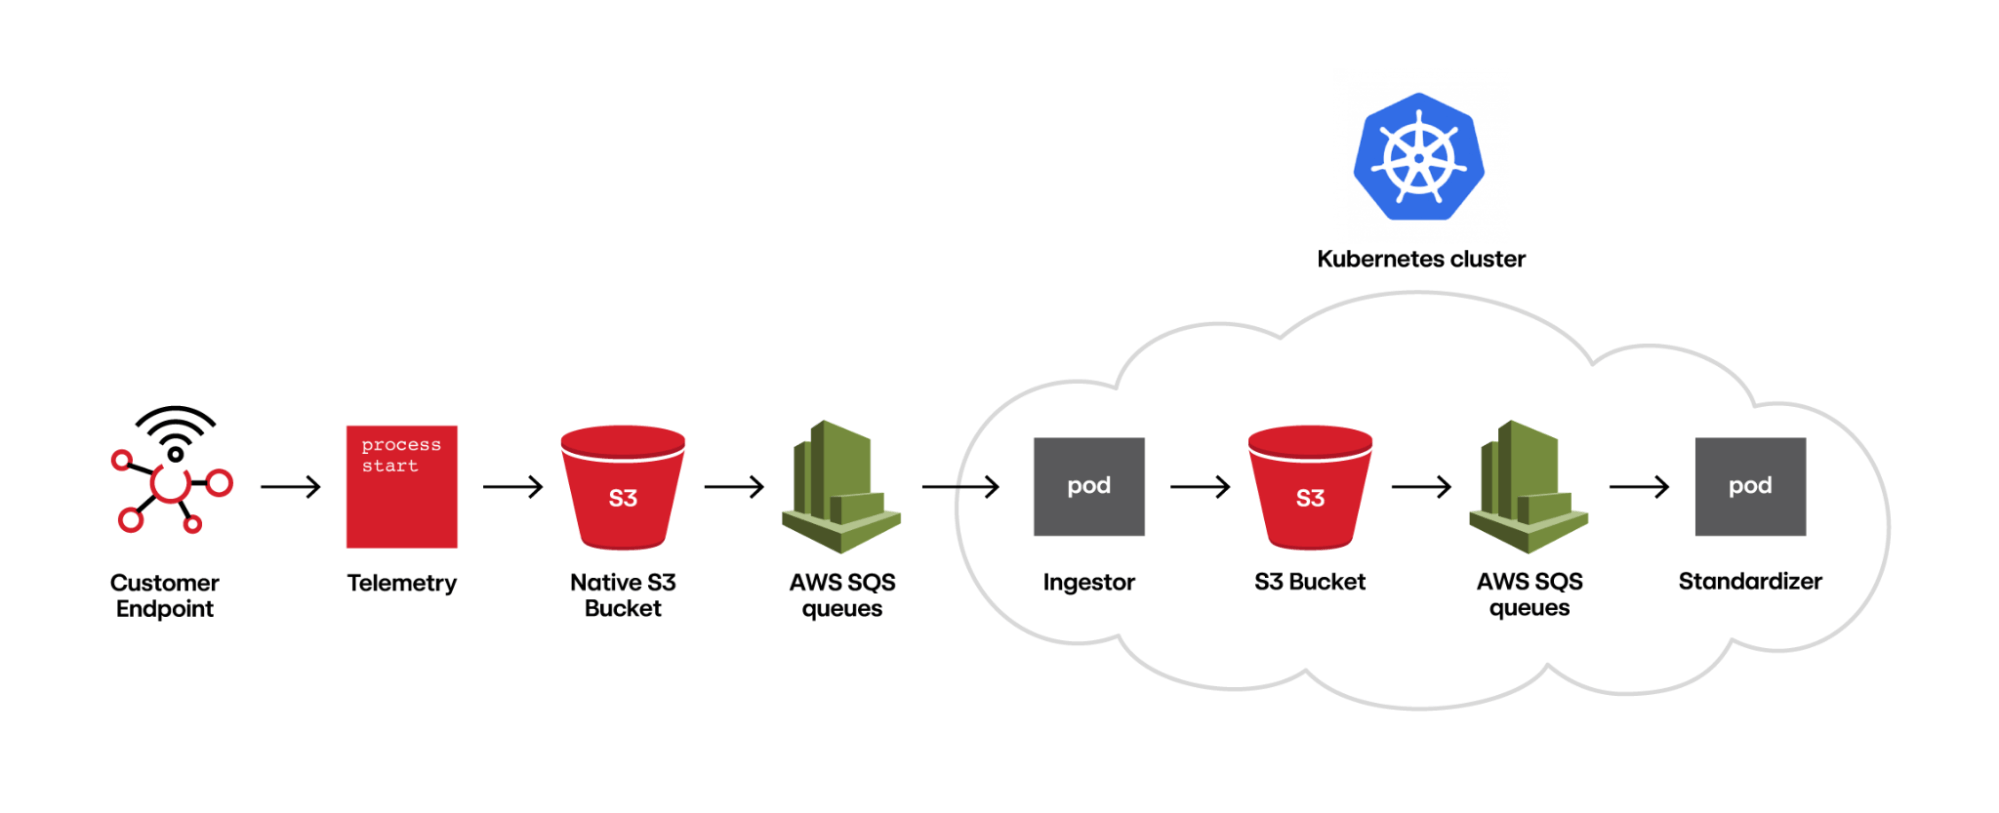
Red Canary’s managed detection and response product runs on a chain of independent components that process messages of telemetry from endpoints, networks, cloud systems, and other environments. This allows our system to scale each component as necessary to handle load spikes in the incoming telemetry stream. Specifically, once data is ingested from our customers, it flows through a series of AWS SQS queues where a component will read an SQS message, fetch the corresponding file from S3, perform its processing, and emit the processed file to an output bucket in S3. The components are deployed into our Kubernetes cluster and leverage horizontal pod autoscaling to allow each component to grow or shrink to meet the demand of the current data volume.
Each component of this chain exists in a shared repository and is deployed as an identical Docker image, the purpose of which is controlled at runtime. Optimizing for developer productivity in our earlier years, we started off implementing this in Ruby with the JRuby interpreter.
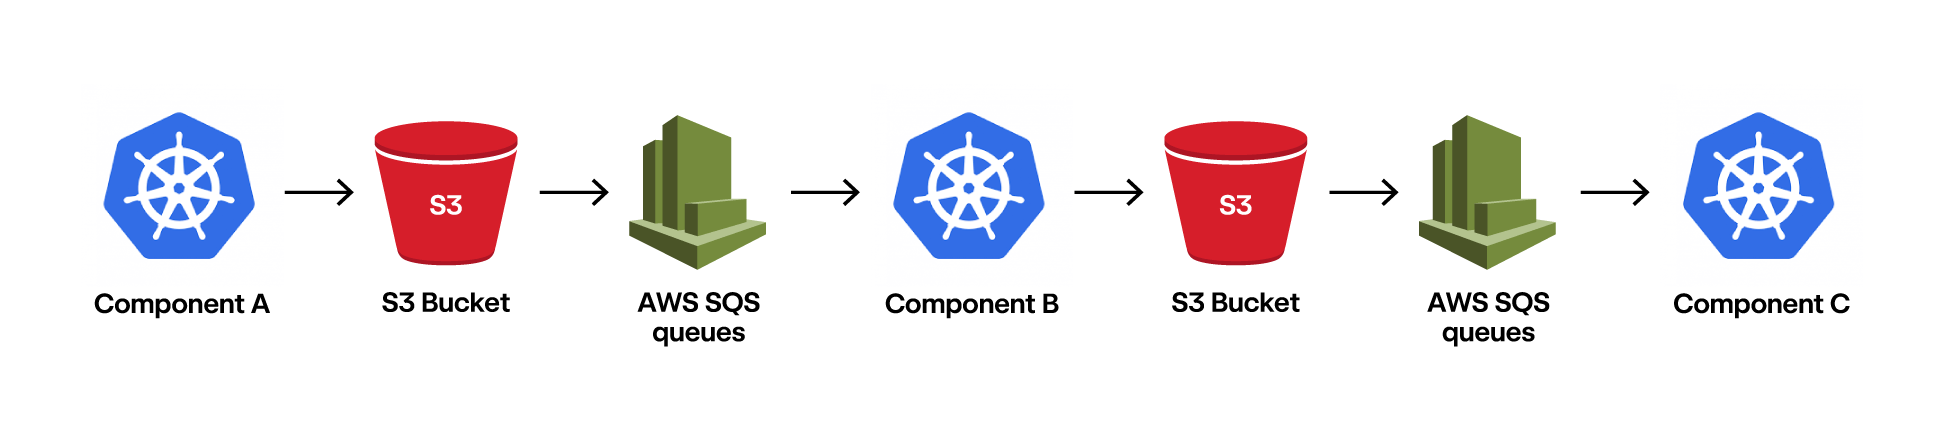 Each component individually scales via Kubernetes and buffers via SQS queues
JRuby served us well for many years; it gave us faster metaprogramming and easier concurrency for our production workload. But after years of service, our data volume had grown such that the compute cost of our most heavyweight JRuby component was $4,800/day, and we needed to bring that down.
As a company with a strong Ruby background, we needed to take care in our language choice. Efficiency is important, but we can’t expect success if we went straight to hand-rolled assembly. After polling a few of our engineers, we landed on Go. We decided that a statically typed and garbage-collected language would give us the best chance of success, while still staying within the boundary of familiarity.
Term evaluation
Red Canary’s detection engine roughly consists of three stages: ingestion, standardization, and detection. During ingestion, we take vendor-specific telemetry, such as Microsoft Defender for Endpoint, and translate it into files consisting of newline-delimited JSON. During standardization, we translate the vendor-specific telemetry into our own standardized format to provide consistency across all telemetry types. During detection, we use our custom detectors to evaluate whether the telemetry contains interesting or anomalous data and should be brought before one of our detection engineers—this is what we’ll focus on in this blog.
Each component individually scales via Kubernetes and buffers via SQS queues
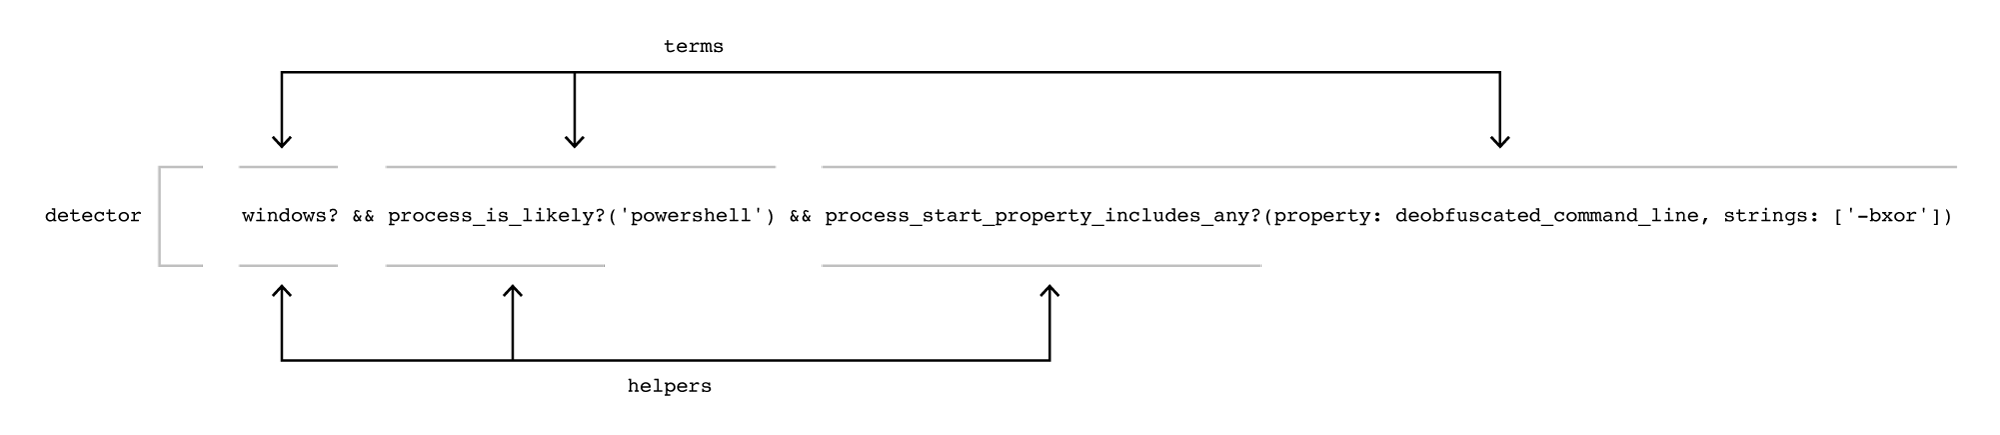
Our detectors are written in a Ruby-like domain specific language (DSL) and are composed of individual “terms” that ultimately resolve to a single boolean. For example, a detector that fires on telemetry indicating a PowerShell command leveraging a binary XOR operation to further obfuscate its payload would be:
windows? &&
process_is_likely?('powershell') &&
process_start_property_includes_any?(property: deobfuscated_command_line, strings: ['-bxor'])Each of the three terms must evaluate to true for the detector to fire. Instead of processing each term in each detector, we evaluate which terms are true before matching them with detectors. Evaluating the list of possible terms ensures that we never duplicate the processing of a single term. We then perform a second stage of processing to calculate the detectors that fired based on the results of processing the terms.
Each term, in turn, is composed of a single “helper” function. This is the base of our DSL where we implement a Ruby function to inspect the piece of telemetry. For example, the above term process_start_property_includes_any?(property: deobfuscated_command_line, strings: ['-bxor']) uses the helper process_start_property_includes_any. The implementation is further abstracted such that process_start_property_does_not_include_any or process_start_property_equals_any are all handled without needing a new explicit helper implementation.
 Breakdown of a detector
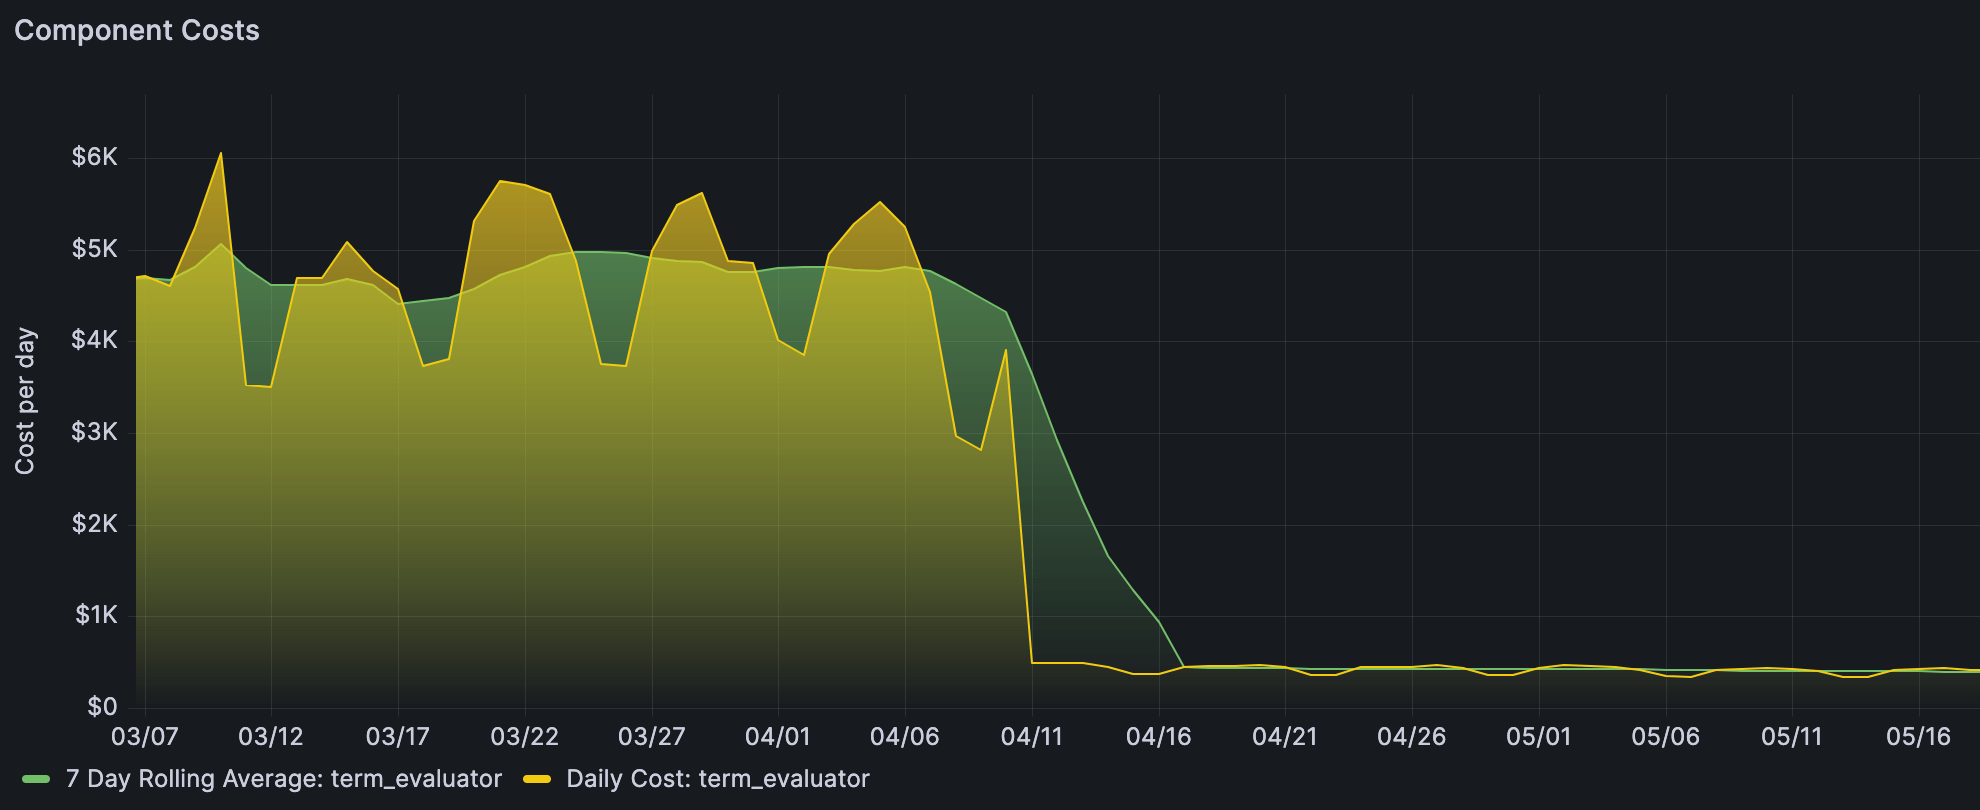
As you can imagine, evaluating these terms on our current production volume of 4.5GiB/s of telemetry takes quite a bit of computation. It was our most expensive component to run for quite some time, and thus was at the top of our list when we looked for areas to lower our compute bill.
Testing our theory
The goal of this project was to reduce the compute cost of our most expensive component. The problem was, we didn’t know how effective a simple rewrite could be. To solve this, we picked one of our simplest components to start with: Threat-Intelligence. Threat-Intelligence reviews incoming telemetry for known indicators of compromise (think file hashes, Windows registry keys, and internet domains), and flags them for our detection engineers. Porting this as a test component proved extremely beneficial, as it let us try out some code patterns and see just how successful we may be before spending the effort to port over the more complex Term-Evaluator. After rewriting and testing to confirm efficacy, we confirmed that our full scale rewrite would cost just 15 percent of the existing JRuby implementation for this smaller component. Reducing compute costs by 85 percent was better than we’d hoped for, and the project was good to move forward.
Optimizing along the way
Term-Evaluator, as mentioned earlier, evaluates individual terms on each piece of incoming telemetry. Today we have 6,282 terms, a number that grows as our detection engineers continue to define better ways of identifying threats and protecting our customers. To support this growth, our JRuby implementation leveraged metaprogramming to evaluate all possible terms that may apply for the incoming telemetry type (process start, network connection, file modification, etc.). This implementation allowed our detection engineers to develop and refine detectors, and quickly release new detectors that leverage new terms without any deployments. This implementation works great, but results in more terms being evaluated than necessary.
Since terms are combined with boolean operators to form a detector, not every term needs to be evaluated for a detector to fire. For example, consider the pair of detectors below:
Detector 1:
process_start_property_equals_any?(property: process_name, strings: ['explorer.exe']) &&
process_start_property_equals_any?(property: username, strings: ['user.a']) &&
process_start_property_equals_any?(property: file_name, strings: ['file.a'])
Detector 2:
process_start_property_equals_any?(property: process_name, strings: ['explorer.exe']) &&
process_start_property_equals_any?(property: username, strings: ['user.b']) &&
process_start_property_equals_any?(property: file_name, strings: ['file.b'])We can build a tree that allows short circuiting to skip the processing of terms that don’t need to be evaluated:
process_start_property_equals_any?(property: process_name, strings: ["explorer.exe"]) [1 2]
   process_start_property_equals_any?(property: username, strings: ["user.a"]) [1]
process_start_property_equals_any?(property: file_name, strings: ["file.a"]) [1]
   process_start_property_equals_any?(property: username, strings: ["user.b"]) [2]
process_start_property_equals_any?(property: file_name, strings: ["file.b"]) [2]From this term tree, we know that if a process name isn’t explorer.exe, we can skip evaluating the remaining terms under the root term. Applying this optimization to our full suite of detectors allows us to short circuit out a significant number of terms.
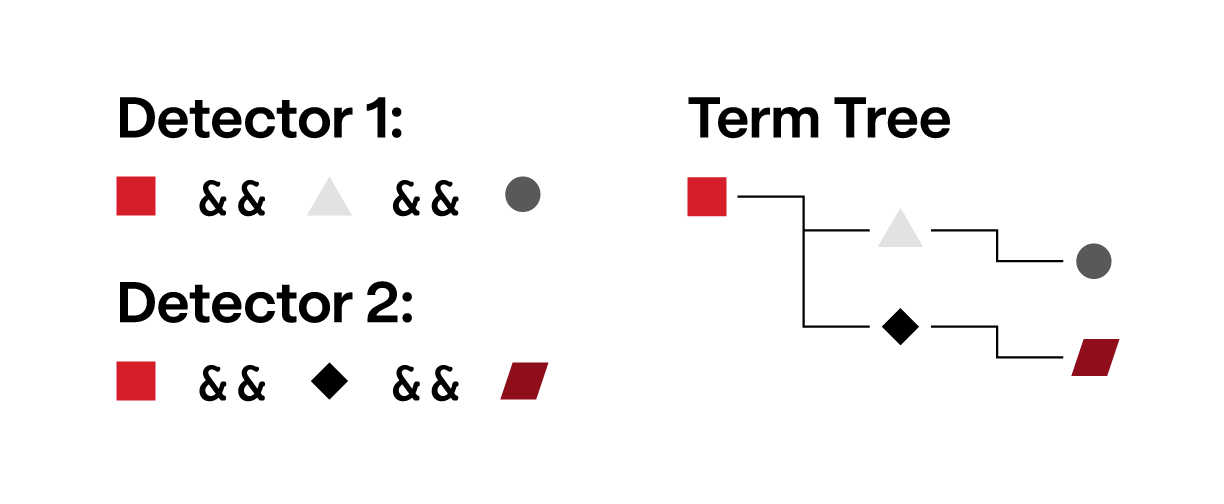
Graphical representation of the term tree
Porting the DSL
As mentioned earlier, our detectors are written in a Ruby-like DSL. This made sense for our JRuby implementation, where we could do some light metaprogramming and ultimately pass each term to the interpreter. With Go, this isn’t an option since we have no Ruby interpreter at our disposal. Rewriting all our detectors in another language was both too risky and would take too long. Instead, we opted to fully parse our detectors into an Abstract Syntax Tree (AST) then evaluate that AST on the telemetry.
Our DSL is relatively simple, with only 30 token types compared to Golang’s 80. Leveraging this simplicity, we opted to write a Pratt Parser to convert our detectors into an AST that we can interpret against the telemetry.
For example, our earlier process_start_property_equals_any?(property: file_name, strings: ['file.a']) term tokenizes into <FUNC><LPAREN><IDENTITY><OBJECT><COMMA><IDENTITY><LBRACKET><STRING><RBRACKET><RPAREN>. The AST representation is a parent FUNC node with two children: an OBJECT (file_name) and a LIST (['file.a']).
Now that the detector strings have been converted into our AST, we traverse the AST nodes to start building our term tree with the help of the raw string. Our example term’s helper name process_start_property_equals_any is mapped into a constant and embedded in our term. At this step, we also do a string suffix comparison to determine a match type: an additional equals_any constant is embedded in our term. Next, each of the child parameter nodes are visited: the file_name is mapped into a constant and embedded, and the ['file.a'] string array is embedded as a value. At this point the term consists of four parts: the process_start_property_equals_any constant function name, the equals_any constant matching type, the file_name constant property name, and the ['file.a'] string array. These four parts to the term let us interpret it against any piece of incoming telemetry.
At runtime, we match the term to this telemetry:
- Our constant
process_start_property_equals_any function nameis known at compile time to only apply to telemetry of typeprocess_start - The
file_nameproperty tells us to extract thefile_namefield from the telemetry for matching - The
['file.a']string array is used as the other half to match - The
equals_anymatch type lets us share a single matcher function for nearly all terms
Implementing our own AST is not without drawbacks though. The parsing code looks foreign and complicated to anyone unfamiliar with it, and implementing new tokens or constants requires some tedious boilerplate code. However, with six years of running our detection engine in JRuby, we’ve only needed to add new helpers or properties a handful of times, making maintenance quite manageable.
On concurrency
One area that we explicitly did not optimize around was concurrency. Whereas our JRuby implementation split each file into even portions and processed across each pod’s allocated core count, our Go implementation was given a single CPU core. We did this for a couple of reasons: managing channels and goroutines can be confusing for people new to Go, and our basic performance measurements indicated we could meet our service-level objectives (SLO) just using our existing horizontal pod autoscaling.
We did, however, allow our pods’ CPU to burst above 1 core. Kubernetes pod resource allocations are enforced in the CPU scheduler as cpu.cfs_quota_us over cpu.cfs_period_us. How this CPU time is spent is completely up to the process; this does not change the number of cores visible in the pod. By default, Go’s concurrent garbage collector will use all cores visible to it, meaning it can exhaust a “1 core” pod’s resource allocation if a pod is scheduled on a node with multiple cores. By shaping our pods to request 1 core but allow a limit of up to 1.25 cores, the garbage collector can complete its concurrent processing without being throttled by the CPU scheduler. We arrived at the 1.25 core limit by capturing CPU profiles and traces, measuring (and tuning via GOGC) how much CPU the GC operations needed.
End result
As mentioned earlier, our production infrastructure is a publisher/subscriber model deployed on Kubernetes. This makes it safe and convenient to test new components—we create a new SQS topic to duplicate the production data stream and deploy our prototype to read from that topic.
The statelessness of this component makes it very easy to do our efficacy testing as well. We simply compare the JRuby and Go outputs for a given input. The size of our production datastream also means that it only takes a few hours of 100-percent matching outputs to get confidence that our rewrite is correct.
We transitioned our test and production data over to the new system customer-by-customer to safely and quickly revert if we saw anything go wrong. Once the dust settled, we saw a cost reduction from $4,800/day to $400/day: even better than what we’d seen in the Threat-Intelligence prototype!
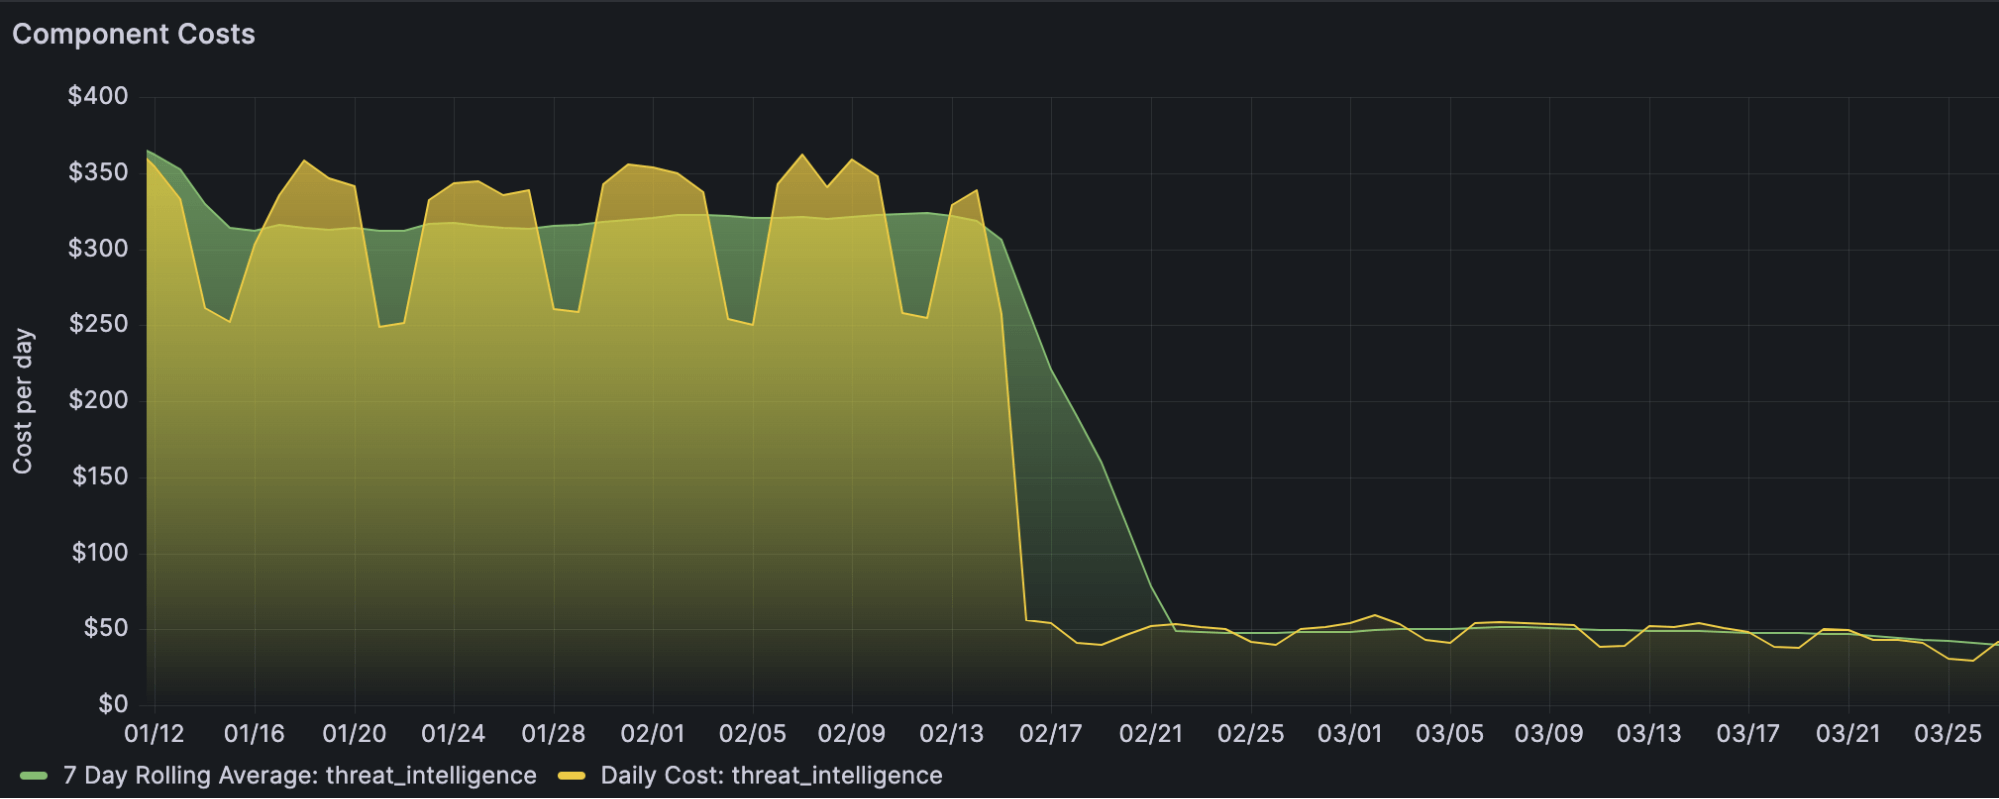 Once the dust settled, we saw a cost reduction from $4,800/day to $400/day.
In conclusion, migrating our threat detection engine from JRuby to Go saved a significant amount of money on our compute bill and let our autoscalers make more fine-grained changes to pod counts. The choice of language, realistic testing, evaluation optimizations, and concurrency restriction all played pivotal roles in achieving the remarkable reduction in compute costs. As the cybersecurity landscape continues to evolve and grow, such adaptations have become integral to ensuring the effectiveness and sustainability of threat detection systems.
Related Articles
The dual-use dilemma: Rethinking detection for remote access tool abuse