
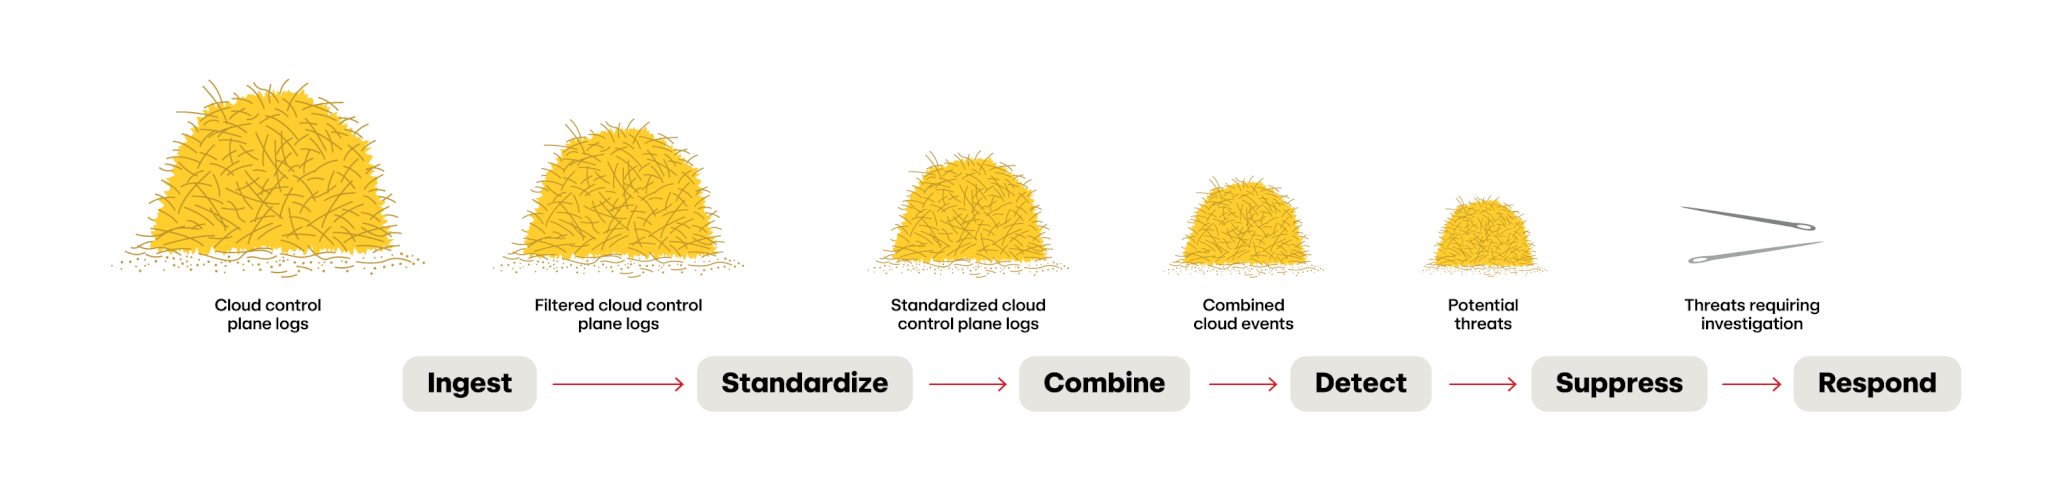
In part one of this series, we walked through the six phases of cloud threat detection to illustrate how Red Canary needles in on cloud threats in the haystack of 6 million cloud telemetry records per day.
Now that you have an idea of what a cloud threat detection engine should do, the next question is: “how do you build it?”
As with any technical challenge like this, there are a lot of options and the one you and your team choose will largely be driven by your own specific constraints. These constraints may be cost, schedule, team expertise, or “prior art” that may exist within your organization that you can leverage (or deliberately avoid).
So let’s dig into some of these design choices and share some insight about what your options may be, along with what Red Canary uses for our own implementation.
Step 1: Choose your runtime framework
Most of the popular data processing frameworks come with tons of community support; your choice here likely will be influenced more by how much “out of the box” functionality you want vs. specific customization you’d like. Here’s an incomplete list of options that are worth considering:
- Kubernetes
- Serverless (Lambda, OpenWhisk, Functions)
- Apache Spark
- Apache AirFlow
- Apache Flink
- Red Panda Connect (formerly Benthos)
- cribl
What Red Canary uses
Red Canary runs nearly everything on top of Kubernetes: specifically, Amazon’s Elastic Kubernetes Service (EKS) and Azure Kubernetes Service (AKS). We used to run on an artisanally made, hand-built cluster; if you’d like to know why we don’t do that anymore, you can reference another blog post that I wrote about that here. We made the decision to run on Kubernetes several years ago (after migrating off of Apache Storm due to scalability challenges) primarily to take advantage of inexpensive spot instances in both cloud providers we run on (which is effectively excess-compute capacity that hyperscalers offer at a steep discount).
Each of the threat detection phases is deployed as a separate, independently scalable Kubernetes deployment, which allows us to add capacity if bottlenecks appear in the processing pipeline.
Our engineers frequently discuss running these components as “serverless functions” (i.e., AWS Lambda functions) to reduce runtime overhead, however our back-of-the-envelope math always shows us that, for us, the cost would be significantly higher and prohibitive.
At a smaller scale, however, this pipeline fits quite well into Apache Spark jobs, which can be readily executed in any cloud environment.
Step 2: Choose your language
Now, your runtime framework may influence your language of choice, but otherwise you can choose to write in just about any language that you want. The beauty of independent components is that each can be written in different languages to suit your needs or your teams’ expertise.
If you and your team know Python, use that. If you know Ruby, use that. If you know perl? Don’t use that….
Be aware, however, that certain runtime frameworks, such as Apache Spark, may constrain you to certain languages such as Java, Scala, Python, and R.
What Red Canary uses
Initially, all of our codebase was written in Ruby (with our front end written in Ruby on Rails). This may seem like an odd choice for data processing, but we knew that it would be extremely fast for us to write—plus there’s a huge advantage to having a single language throughout your tech stack. The downside of Ruby was that it was rather pricey to run (due to the fact that it’s not very efficient in data processing); but we determined that speed of implementation was more important than runtime cost.
Recently, however, we’ve ported most of our big and expensive data processing components over to Go to yield significant cost savings (you can read more about that in this blog).
Step 3: Choose your messaging technology
Your options are also very wide here. Some technologies, like Apache Spark, will handle data transfer between workers for you, or you can use a separate technology like Apache Kafka or RabbitMQ.
When selecting a messaging technology, you’ll want to ensure it can do the following:
- easily scale as your load increases over time
- allows you the ability to replay messages in the event of a processing failure or error
- lets you monitor the message queue itself (or via tooling) to ensure that messages aren’t piling up and not getting processed
What Red Canary uses
At Red Canary, in between each of these detection components we use an extremely simple but very effective data transport mechanism of S3 buckets -> SNS topics -> SQS queues in Amazon (or the equivalent for the components running in Azure). This is a well-documented architecture pattern within AWS and provides an extremely scalable and low-maintenance way to move data around.
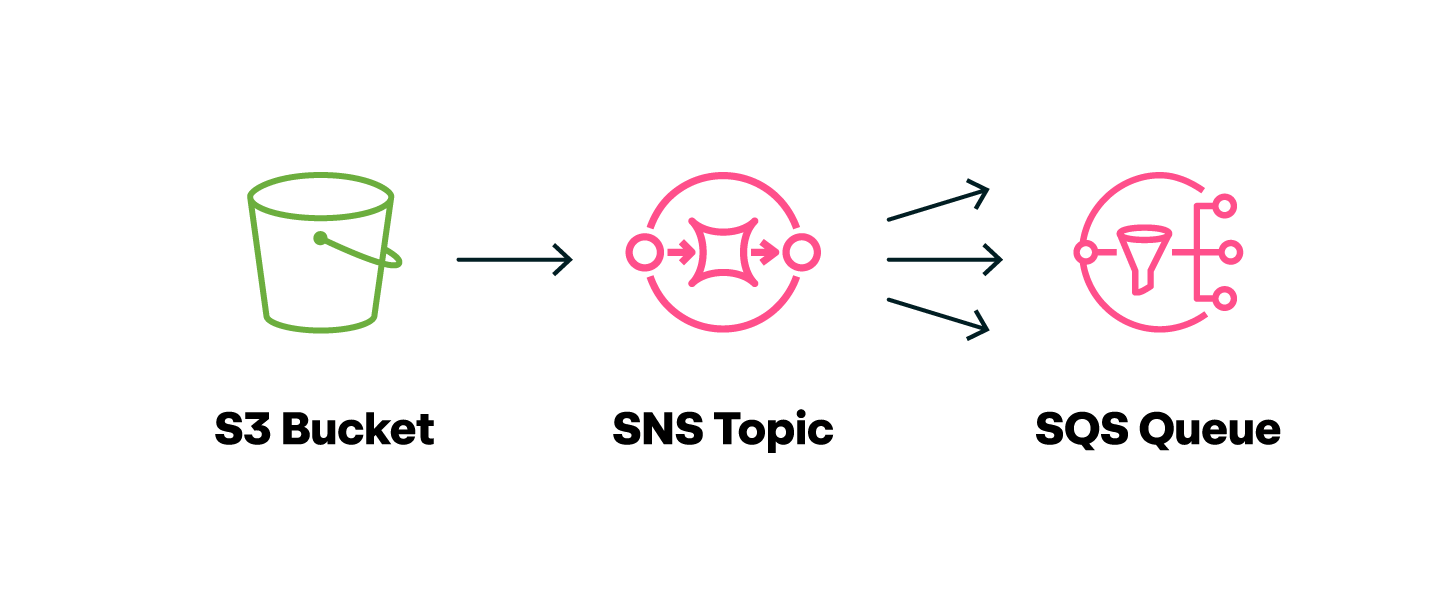
Each component, after it completes doing the one job it’s been built to do, writes a compressed JSON file to S3. AWS event notifications then automatically generate an SNS message on a specified topic indicating that a new file has been written to that location. Any downstream component that wants to do work on this data has created an SQS queue that is subscribed to the aforementioned S3 SNS topic, and will be notified that a new file has been written and is ready for processing. Most of the “plumbing” here is handled by AWS—we just have to wire up the topics and queues for each component.
So why do we use such an arguably simple messaging system between components? A few reasons:
- It’s cheap: This messaging architecture costs us just a few dollars a day to ship around billions of records
- It’s simple: Without a lot of complexity, there’s not a lot of ways it can fail, which is fantastic when you have billions of records in flight at any given time
- It’s easy to retain data for a period of time: S3 lifecycle rules allow for the data to sit around for a few hours or a few days—however long you need it to allow for long-term archival or replaying messages in the event of a system failure
- It’s extensible: The SNS -> SQS pattern allows as many components you’d like to consume the same data, allowing you to fork data paths depending on whatever your system architecture requires
After reading all of this, you might be thinking, “But Brian! We can do this all in a single process!?” Sure—you absolutely could, but you’re in the cloud. That’s not a snarky response; that’s a reality that you need to plan for because when you’re in the cloud, things can (and do) scale incredibly fast. This isn’t like the old days where scaling up required procuring and racking more servers in the basement. Instead, a single button push could increase your telemetry volume by an order of magnitude. One action that an individual can do in your organization, like querying the internal data lake in S3, could generate millions of telemetry records in a matter of seconds.
If the processing pipeline isn’t built to scale, it will become hopelessly backlogged with data.
Step 4: Choose your infrastructure
As the scale of your monitoring framework increases and you need to create more cloud resources, it often makes sense to leverage an infrastructure-as-code (IoC) platform to build consistently. There are lots of options available to you: each cloud provider has their own platform such as AWS CloudFormation, Azure Resource Manager (ARM), Bicep (my personal favorite), Google Cloud Deployment Manager, or you can use a platform-agnostic tool such as Terraform or OpenTofu.
What Red Canary uses
Red Canary leverages Terraform, which allows us to create:
- a single module that establishes an S3 bucket
- a lifecycle rule to age out the data within that bucket
- an SNS topic for files written to that bucket
- an SQS queue for the downstream component
- a development SQS queue that can be consumed by a dev-based component
- CloudWatch alarming on the production SQS queue in case too many messages back up in it or if the age of messages exceeds a threshold
Thanks to Terraform, we can cookie-cutter out the necessary infrastructure in between our components in a consistent way, detect any manual drift that’s occurred to the resources (since Terraform will flag these changes and revert them back to the “known” state), and, most importantly, limit critical infrastructure management permissions to Terraform instead of individual engineers.
Step 5: Consider your unique objectives
There are dozens, if not hundreds of additional considerations to think about when building a processing pipeline like this, depending on how polished and/or hands-off you’d like the system to be. A few that come to mind:
- auto-scaling that can be established to ensure that components scale up or scale down on demand
- operational monitoring to “see” what’s happening within the system
- alerting to notify you when some key processing parameter has exceeded a predefined threshold
- developer tooling to enable developers to quickly develop and deploy their code
The good news is that, like many things in software, these can be added over time as the need arises and are not all required on day one. Additionally, many wonderful open source tools provide these capabilities and can minimize the costs on an organization trying to evolve a more sophisticated capability.
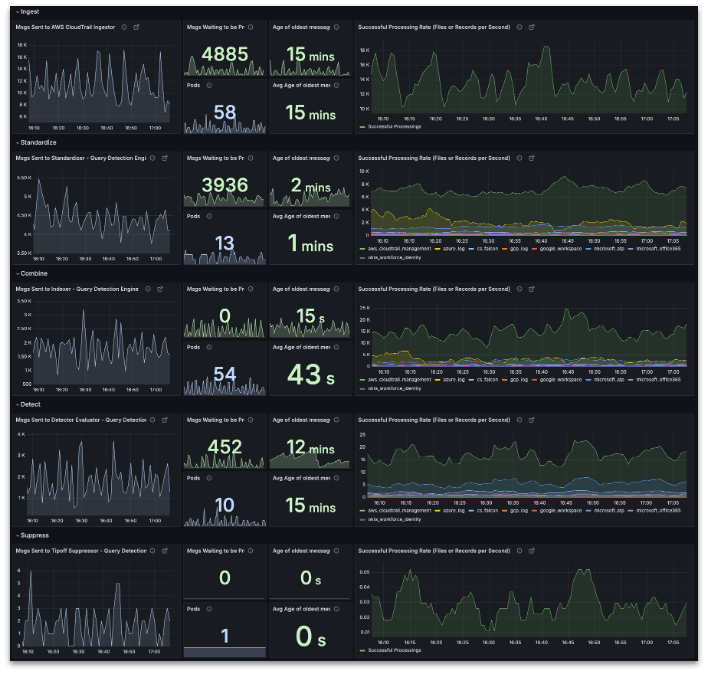 Example monitoring dashboard showing the processing of each component in a pipeline
Step 6: Put it all together
Let’s take a step back and look at the big picture again with all of the pieces we’ve talked about.
When you stitch all of these pieces together, it provides tremendous flexibility in all directions: scalability, development, detector development, and anything else you can think to throw at it.
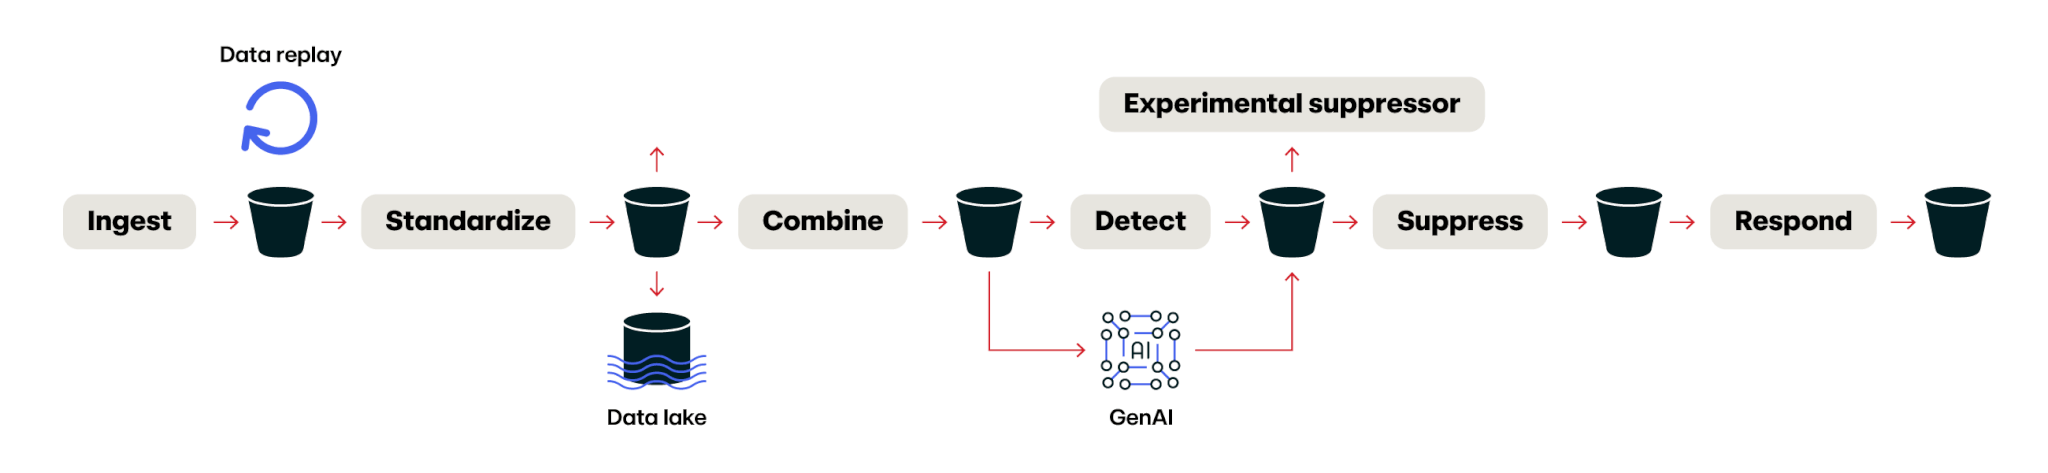
A stitched-together and expanded processing pipeline
For example, in this design, you can easily attach a data lake to your standardization component, allowing you to immediately create a silver or gold layer (of a medallion architecture) from the data you’re processing in your pipeline already. Or you can inject a generative AI component in parallel with your detection logic to see if it performs any better. Teeing off a new experimental component, like the suppressor shown above, is as simple as making a new SQS queue and connecting your new component to it (allowing you to process the exact same events as the “production” path, without impacting the production path at all).
This file-based architecture also allows the easy replay of data for when you make a mistake and process something incorrectly. This decoupled architecture also allows for gradual evolution of the pieces over time—for example, when we ported our processing engine to Go, we replaced one of these components at a time (after running it in parallel to verify the outputs for a period of time).
Key takeaways
Between both parts of this blog series, there’s a lot to take in. If you only walk away with a few key points about cloud threat detection, consider the following:
- Break down the problem: Create simple, modular components that scale
- Use cloud-native building blocks: simple cloud primitives (such as S3 buckets and SQS queues) can go a long way
- Leverage community expertise: Lean on the intel trends of the community to enhance your detection coverage
Related Articles
The dual-use dilemma: Rethinking detection for remote access tool abuse