
Most security operations centers (SOC) understand the importance of setting and tracking success metrics. Even so, security teams have different definitions for success and deploy different capabilities that require different kinds of measurements—making it hard to know what we should be measuring. If you go looking for security metrics online, you’re going to find a bunch of articles talking about mean-time-to-something (e.g. detect, respond, remediate, resolution, etc.). Timeliness is a super important SOC metric, but it’s certainly not the only one and time-based metrics can be misleading and problematic, whether you’re consuming or creating them.
Time-based metrics can be misleading and problematic, whether you’re consuming or creating them.
There’s more to a SOC than detection and response, but that’s the business we’re in and that’s what we’re going to focus on (although these metrics can probably be adapted to other security disciplines). While measuring security success may seem overwhelming, most teams can get off to a great start by focusing on just three broad categories:
- Accuracy: How often are you detecting false positives or missing threats altogether?
- Volume: How many threats are you detecting and incidents are you responding to?
- Timeliness: How often is it taking you too long to detect threats?
Before we explain why and how you should consider measuring these things, let’s talk about some common problems with SOC metrics you’re very likely to encounter if you go looking for them on the internet.
The problem with mean-time-to-*whatever
You’ll see a lot of public metrics based loosely on adversary dwell time (i.e., the amount of time an adversary has access to a system). Dwell time is typically expressed as “mean-time-to-something.” There’s mean-time-to-detect, -respond, -investigate, -remediate, -resolution, and more. The problem starts with the first word: mean. Median is the statistic that most organizations should probably measure. The reason for that is simple: one extreme outlier, say an unmonitored asset where a threat sits idle for two months, can skew your mean considerably, whereas median is more resilient to outliers.
An example!
Take the following detection times:
- 10 minutes
- 12 minutes
- 15 minutes
- 18 minutes
- 1,440 minutes (24 hours)
The median across this data set is 15 minutes. The mean is 299 minutes (almost 5 hours!). The median here is a better representation of what you can typically expect, whereas the average is heavily influenced by a single outlier. Beyond that, median is a far more standard measure for statistical analysis than mean.
What do these words mean and when does the clock start?
Beyond the numbers, any time-based SOC measurement depends on a variety of factors related to how we define words like “detect” or “respond” or “mitigate” and, relatedly, when you start and stop measuring.
Let’s take time-to-detect as our first example. In the context of Red Canary, detect could mean the moment our engine detects a potential threat, in which case our time-to-detect would be impressively low. But that would include the many millions of events we ultimately end up hiding or suppressing each year because they are benign. Alternatively, detect could also mean the moment we confirm the veracity of a threat or it could mean the moment we publish a threat (i.e., we’ve concluded investigating, built a threat timeline, and sent that information to a customer). This begs the question: when is a threat detected?
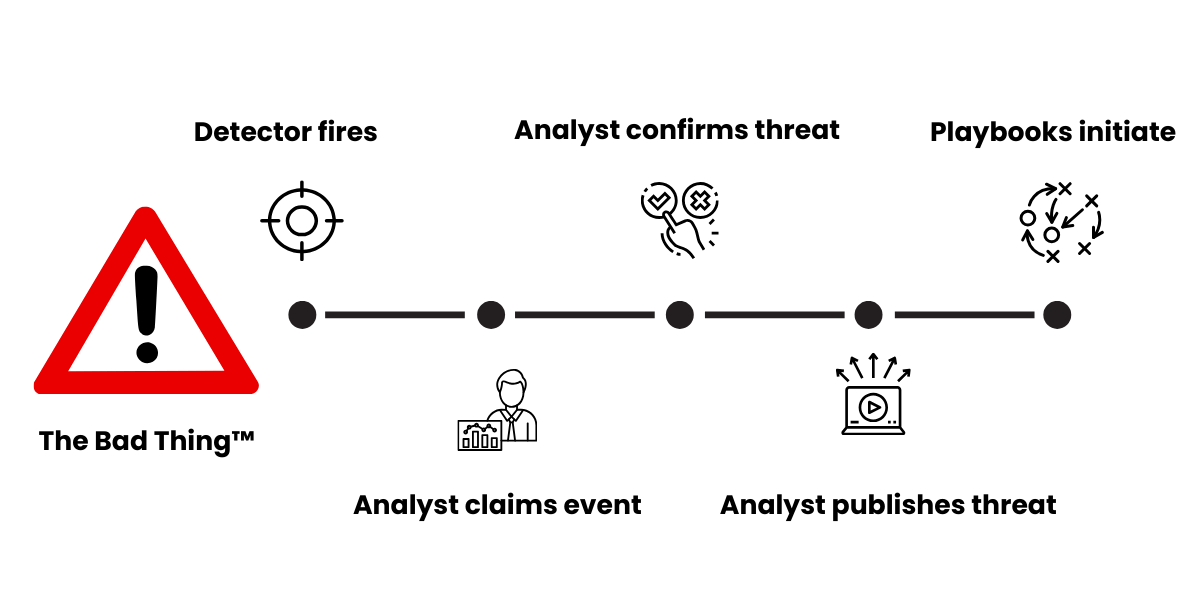
Simplified rendering of a detection workflow
Put another way, when does the clock start? Does it start at the exact moment that the bad guy did the bad thing? Does it start the moment the EDR or other security tool generated a record of the bad thing? Does it start the moment the Red Canary engine ingested the telemetry corresponding with the bad thing? Further confusing the matter, there can be unpredictable delays at nearly any point in this process.
If you apply these same questions to response or mitigation, the problem becomes even more complex because it’s vastly simpler to define the concept of detecting than responding or mitigating.
For example, does simple acknowledgment of a threat count as a response? Does response start the moment your SOC begins investigating a potential threat? Does there need to be an automated action that is taken, such as isolating an endpoint? Or is response inclusive of an entire incident response process? Some organizations may simply base these measures on the opening and closing of tickets.
Unpacking all the variables
Let’s say that Red Canary’s median-time-to-respond is 19 minutes. This isn’t particularly useful information on its own. It’s just a number. For it to make any sense, we have to explain that we start the clock the moment the threat occurs (i.e., the second the adversary did a suspicious or malicious thing on a protected asset). We also have to explain that we’re defining “respond” as the moment we send a threat timeline to a customer and the point at which their automated response playbooks kick in.
If it’s a particularly severe threat—like clear and obvious pre-ransomware activity—we’ll have contacted the customer before we publish the threat, so the publish time doesn’t necessarily correspond with the moment a customer becomes aware of a problem. Further, you have to take it on faith that I’m telling you the truth and that we aren’t fudging the numbers or playing loose and fast with definitions.
It can be difficult to know where to start with your own time-based metrics and it’s impossible to make up or down of publicly reported ones unless you see the math.
Given all of these variables, it can be difficult to know where to start with your own time-based metrics and it’s impossible to make up or down of publicly reported ones unless you see the math—and we’re just talking about the mean or median-time-to* variety of metrics.
There’s certainly value in tracking how long it takes to detect or respond to threats over time. If you’re going to use these kinds of metrics, the key is to be consistent about how you measure. Further, when you’re evaluating a product or service, it’s important to understand the limitations of these metrics when you don’t have all of the context and data that underlie them.
Dwell and breakout time
You also have to consider the difference between dwell time and breakout time. Dwell time is simply how long an adversary has access to a compromised system. Breakout time, on the other hand, is how long it takes an adversary to move from initial access to whatever their next objective is. These time-to metrics are basically a proxy for dwell time, but they tell you very little about breakout time, which is arguably more important and highly dependent on factors like where the threat is found and how an environment is configured.
The right way to measure and define
The fundamental problem with mean/median-time-to metrics arises from the lack of standardized definitions and ways of measurement.
The following table provides some standardization, although it’s worth noting that your visibility may impact estimations of when a threat occurred, which we’ll refer to as an event:
| Terminology | Definition | Example |
|---|---|---|
| Terminology : Event | Definition : The clock starts the moment a malicious or suspicious thing happens on an asset. Not necessarily the same as when your tools become aware of it. | Example : When the user downloads the malicious file. When an adversary logs into an identity. The moment the adversary accesses the asset. |
| Terminology : Detection | Definition : This is the moment you confirm the veracity of a threat. Not the moment the alert fires or the information about the bad thing enters your detection pipeline. | Example : Once you’ve investigated an alert or the output of a detection analytic and determined that it is in fact malicious or suspicious and not a false positive. |
| Terminology : Response | Definition : This is the moment you take an action to counteract a threat. Not the moment you acknowledge the existence of a potential threat. | Example : After you’ve detected a threat and taken an action to stop it, like isolating an endpoint or banning hashes or otherwise starting to remove the threat from the asset. |
| Terminology : Resolution | Definition : This is the moment you’ve eradicated the threat or closed the incident. | Example : The computer has been reimaged and the threat is gone. |
Now, let’s talk about what else you can measure, why you should consider measuring it, and how.
Measuring quality beyond just timeliness
The thing you actually want to track with metrics is the quality of your detection and response capabilities, and so we recommend tracking quality across the accuracy, volume, and timeliness of your detection capabilities
Accuracy: How many false positives and negatives are you detecting?
Very simply put, you can track the overall number of threats you detect, the number of threats that were missed by your detection capabilities, and the number of non-threats that you detected. The tricky part here is twofold: you need a good, general consensus around what constitutes a false positive and you need to keep track of threats that slipped by your detective controls but were caught by something else (or maybe led to incidents).
There will be some grey areas here. For example, maybe your red team is using a scanning tool during a test and you detect it. Some people will consider that a false positive because the tool was technically sanctioned and ultimately benign. Similarly, some teams will consider unwanted or unsanctioned software as genuine threats while others will not. As for misses, you might only learn about these in retrospect because of an incident or maybe you have a threat hunting team dedicated to finding things that your suite of detection tools missed.
If you set a really aggressive goal for decreasing false positives and misses, it may come at the expense of other measures, like expediency.
Benchmarks for false positive/negative rates can and should vary from one organization to another. The point here is to pick a number, and strive to beat it. You can pick the number however you want. Maybe it’s arbitrary, based on something that sounds good, maybe you calculated your accuracy and decided you want that to be the benchmark, or maybe you want to set an aspirational accuracy benchmark that’s above and beyond your current level. You may want to slide the number up or down over time based on your performance, but that’s entirely up to you.
Lastly, if you set a really aggressive goal for decreasing false positives and misses, it may come at the expense of other measures, like expediency for example.
Why does accuracy matter?
This metric is actually telling you two different stories about your detection program—and you may want to track each separately.
- Your false positive rate is all about efficiency. The higher your rate of false positives, the more time your SOC is spending investigating events that, by definition, do not matter. Decreasing the occurance of false positives will mean that your SOC can spend more time doing meaningful work that actually improves security outcomes.
- The benefit of tracking false negatives is all about improving coverage. Every time you miss something, you have an opportunity to identify a gap and close it. Also, every miss has the opportunity to turn into an incident. False negative reduction measurably improves your security posture.
Volume: How many threats are you detecting and how often are they turning into incidents?
This one is simple. Track the number of threats you detect and incidents you experience over time.
Why does volume matter?
Keeping tabs on overall detection volume and, by extension, overall incident volume is all about surveilling the overall health of your organization’s security posture. You may not even have benchmarks for detection or incident volume, and that’s fine. What you really want here is a trendline, like the one below. Note: Our trendline probably looks different from most organizations because we sell detection and response products and expect detection volume to go up over time as we grow.
Red Canary’s overall detection volume from 2019-2025

Deviations from that trendline are useful signals for prioritizing security work. If detections are unusually high, maybe you need to invest time in sorting out some mitigatory or preventive controls that stop threats before you detect them. If detection volume drops precipitously and inexplicably, maybe this is a signal to do some testing to make sure everything is turned on and working.
The same can be said of incidents, but you’ll also want to track incidents relative to detections. If detections are steady and incidents are going up, then you may need to implement automation to more effectively stop threats before they turn into incidents.
Timeliness: Is it taking too long to detect threats?
Last but not least, we are back to our time-based metrics. You could certainly use median or mean-time-to-whatever, which we’ve explained in detail above, but that’s not your only option. You can also consider setting a definition for how long you think it should reasonably take to detect a threat (maybe you use one of your median or mean-time stats as the benchmark). Again, any timeliness threshold will differ from one organization to the next, but the idea is to pick an amount of time and measure how often it’s taking you longer than that amount of time to detect a threat.
By way of an example, maybe you decide that your threshold for timeliness is one hour. From here you simply calculate the number of threats that are exceeding that threshold. It’s fine if some threats take longer than that to detect. What you really want to track here is the number of threats that are taking too long. So you might say, we want to detect more than half of all threats within an hour of occurrence. If that’s easy and you’re consistently outperforming that benchmark, you can shrink the amount of time or increase the percentage.
Why does timeliness matter?
There is certainly a correlation between adversary dwell time and the occurrence of incidents and breaches. And incident and breach avoidance is the name of the game across your entire security program. While the exact correlation is elusive, the general rule is that the longer the threat runs rampant in an environment, the worse off things will be. Optimizing purely for speed may have consequences in the accuracy of your detections. However, if you find that you’re taking too long to detect threats, then that’s a super valuable signal to invest in new tools, more staff, or better processes.
Putting it all together
The wonderful thing about tracking these relatively simple sets of metrics is how they work together. As you work hard to decrease false positives, you may also achieve better timeliness outcomes. If you optimize to decrease false negatives, your time-to measures and volume may go up. Similarly, driving down the amount of time it takes to detect threats or driving down the occurrence of false positives or false negatives may decrease the number of incidents you experience.
Further, clear definitions and consistent measurements are how you’ll know you’re improving over time. If measuring the performance of a vendor or partner, ensure an accurate mapping between your definitions and their own (rather than simply assuming their definition of mean-time-to-whatever is the same as yours).
Some questions you can consider asking them:
- Do you measure your median or mean time to detect, respond, or resolution?
- When does the clock start for each of these time-based metrics and how do you define “detect,” “respond,” and “resolution” in this context?
- What is your false positive and false negative rate?
- What is the volume of threat detection I should expect from your tool?
- How often do your customers have to initiate their incident response plan or call in external incident response services?
Related Articles
Take back control: A modern guide to mastering application control