Behind the scenes
Methodology

Behind the scenes
Methodology
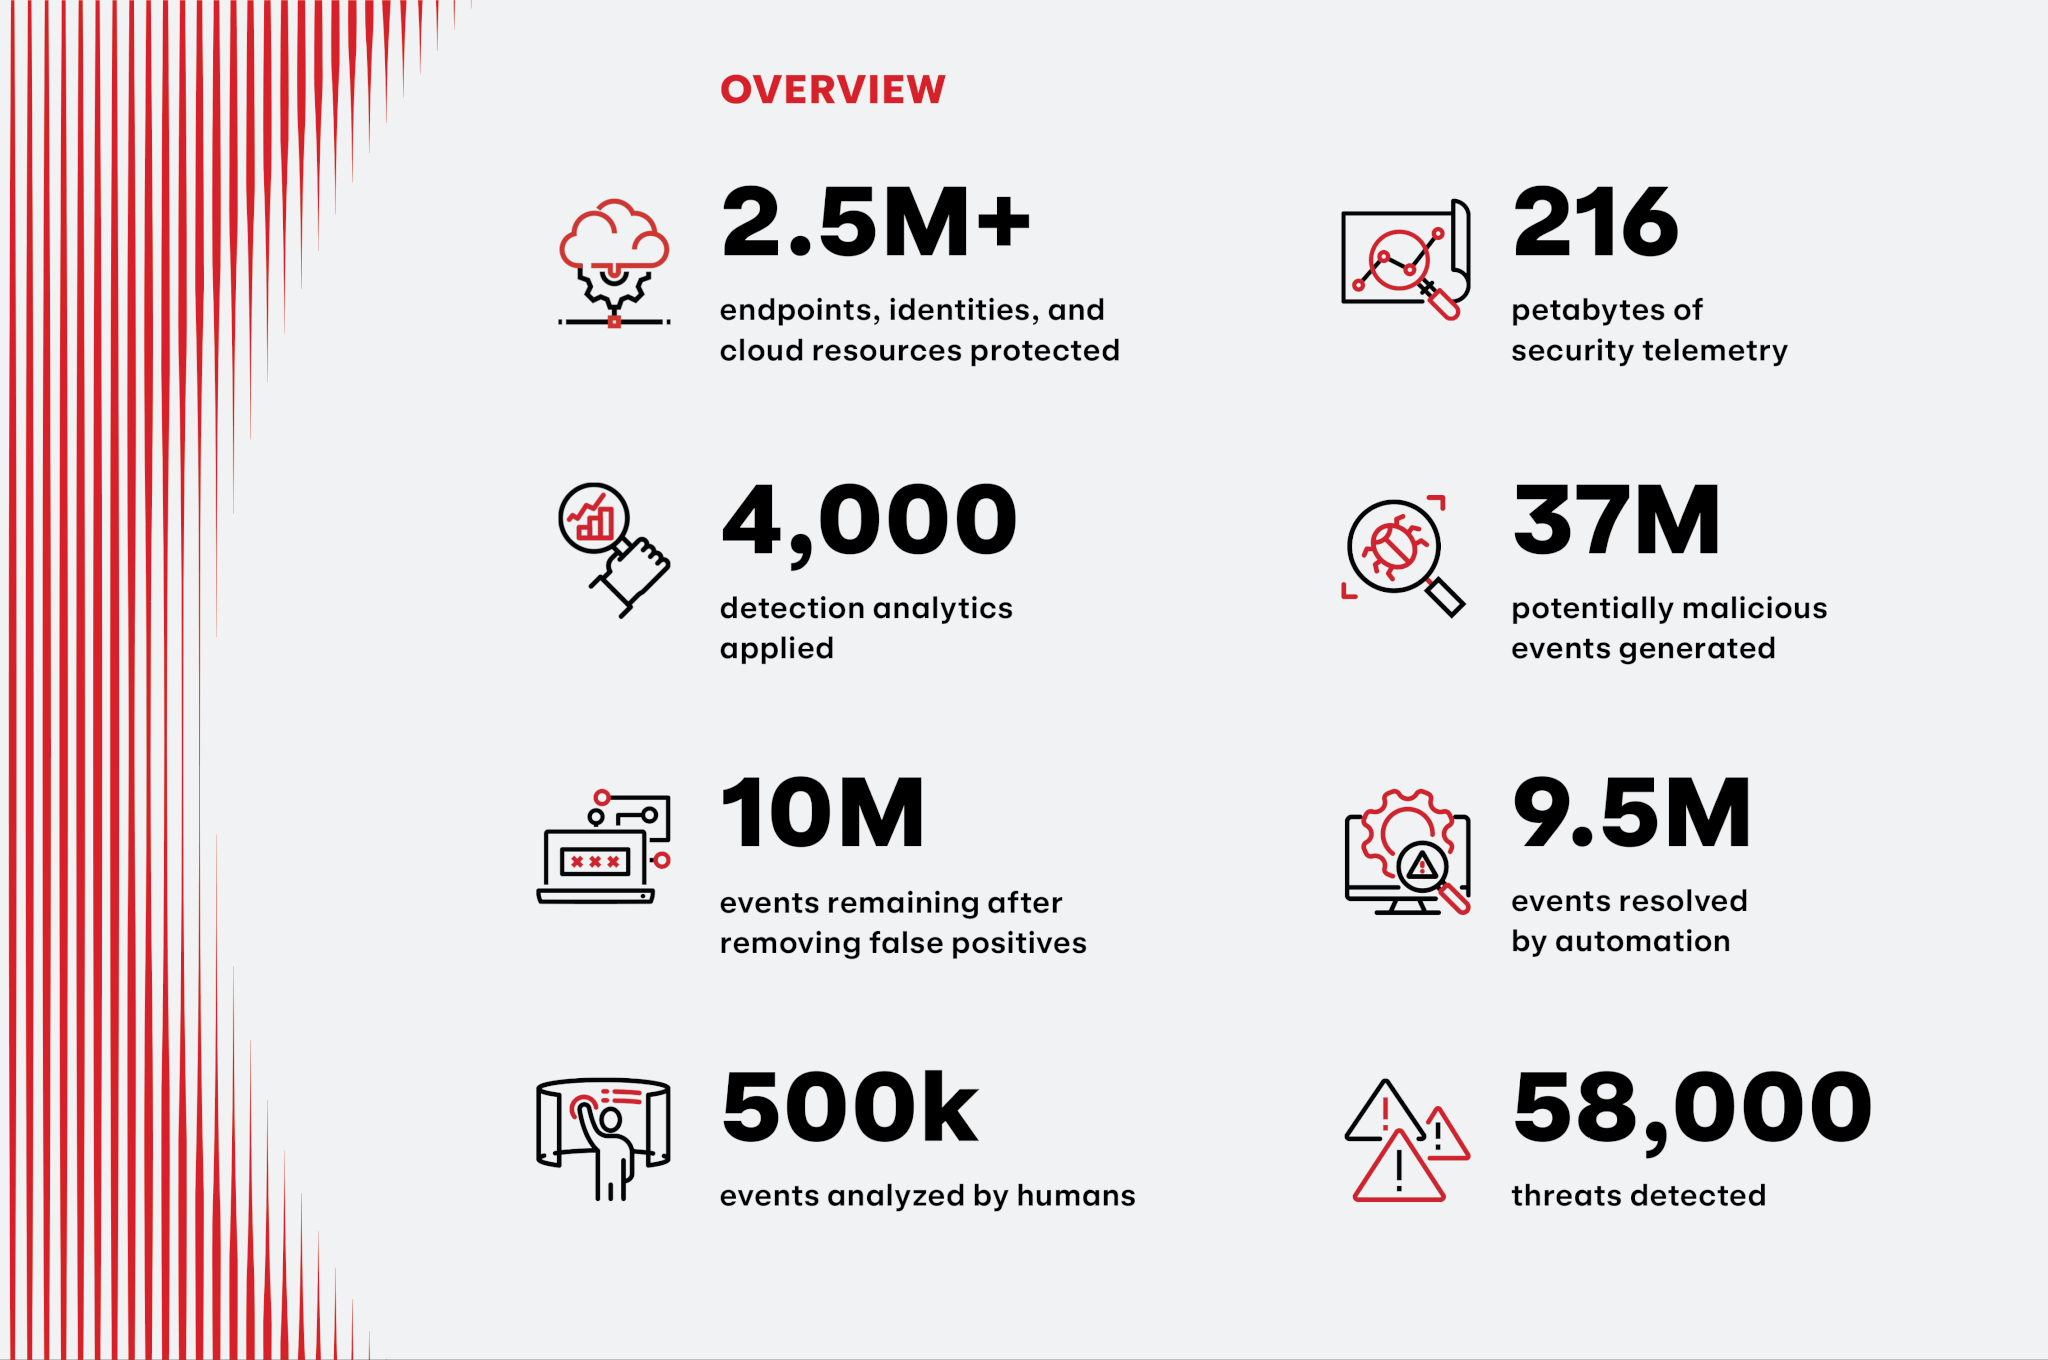
Red Canary ingested 216 petabytes of security telemetry from our 1,000+ customers’ endpoints, identities, clouds, and SaaS applications in 2023. Our nearly 4,000 custom detection analytics generated 37 million investigative leads, which our platform helped us pare down to 10 million events. 9.5 million of those events were handled by automation and 500,000 were analyzed by our security operations team. After suppressing or throwing away the remaining noise, we detected more than 58,000 confirmed threats, every one of them scrutinized and enriched by professional detection engineers, intelligence analysts, researchers, threat hunters, and an ever-expanding suite of bespoke generative artificial intelligence (GenAI) tools.
The Threat Detection Report synthesizes the critical information we communicate to customers whenever we detect a threat, the research and detection engineering that underlies those detections, the intelligence we glean from analyzing them, and the expertise we deploy to help our customers respond to and mitigate the threats we detect.
In 2023, Red Canary detected and responded to nearly 60,000 threats that our customers’ preventative controls missed.
Behind the data
The Threat Detection Report sets itself apart from other annual reports with its unique data and insights derived from a combination of expansive detection coverage and expert, human-led investigation and confirmation of threats. The data that powers Red Canary and this report are not mere software signals—this data set is the result of hundreds of thousands of expert investigations across millions of protected systems. Each of the nearly 60,000 threats that we responded to have one thing in common: These threats weren’t prevented by our customers’ expansive security controls—they are the product of a breadth and depth of analytics that we use to detect the threats that would otherwise go undetected.
What counts
When our detection engineers develop detection analytics, they map them to corresponding MITRE ATT&CK® techniques. If the analytic uncovers a realized or confirmed threat, we construct a timeline that includes detailed information about the activity we observed. Because we know which ATT&CK techniques an analytic aims to detect, and we know which analytics led us to identify a realized threat, we are able to look at this data over time and determine technique prevalence, correlation, and much more.
This report also examines the broader landscape of threats that leverage these techniques and other tradecraft intending to harm organizations. While Red Canary broadly defines a threat as any suspicious or malicious activity that represents a risk to you or your organization, we also track specific threats by programmatically or manually associating malicious and suspicious activity with clusters of activity, specific malware variants, legitimate tools being abused, and known threat actors. Our Intelligence Operations team tracks and analyzes these threats continually throughout the year, publishing Intelligence Insights, bulletins, and profiles, considering not just prevalence of a given threat, but also aspects such as velocity, impact, or the relative difficulty of mitigating or defending. The Threats section of this report highlights our analysis of common or impactful threats, which we rank by the number of customers they affect.
Consistent with past years, we exclude unwanted software and customer-confirmed testing from the data we use to compile this report.
Limitations
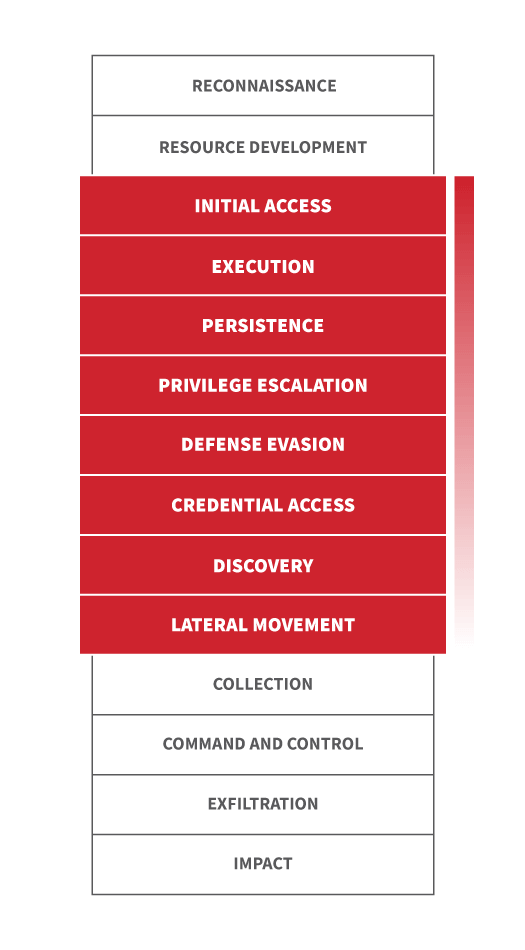
Red Canary optimizes heavily for detecting and responding rapidly to early-stage adversary activity. As a result, the techniques that rank skew heavily between the initial access stage of an intrusion and any rapid execution, privilege escalation, and lateral movement attempts. This will be in contrast to incident response providers, whose visibility tends towards the middle and later stages of an intrusion, or a full-on breach.
Knowing the limitations of any methodology is important as you determine what threats your team should focus on. While we hope our list of top threats and detection opportunities helps you and your team prioritize, we recommend building your own threat model by comparing the top threats we share in our report with what other teams publish and what you observe in your own environment.

