
While Linux has become even more prominent in computing over the last decade via the cloud and containerized apps, relatively little has changed with regards to forensics investigations of these systems. This blog post introduces a new type of Linux telemetry by repurposing a kernel feature designed to limit system resources into an effective form of process enrichment.
What is a cgroup?
Since Linux is the most popular operating system in computer servers, there is a significant need to limit non-critical applications from impacting critical ones, such as serving web requests, managing network traffic, etc. Enter control groups, or “cgroups” as they’re typically called: a feature in the Linux kernel for managing resource limits. These restrictions apply to resources like the number of processes spawned in a group, the max memory available to individual processes, what block devices are available, and CPU throttling when the system is busy.
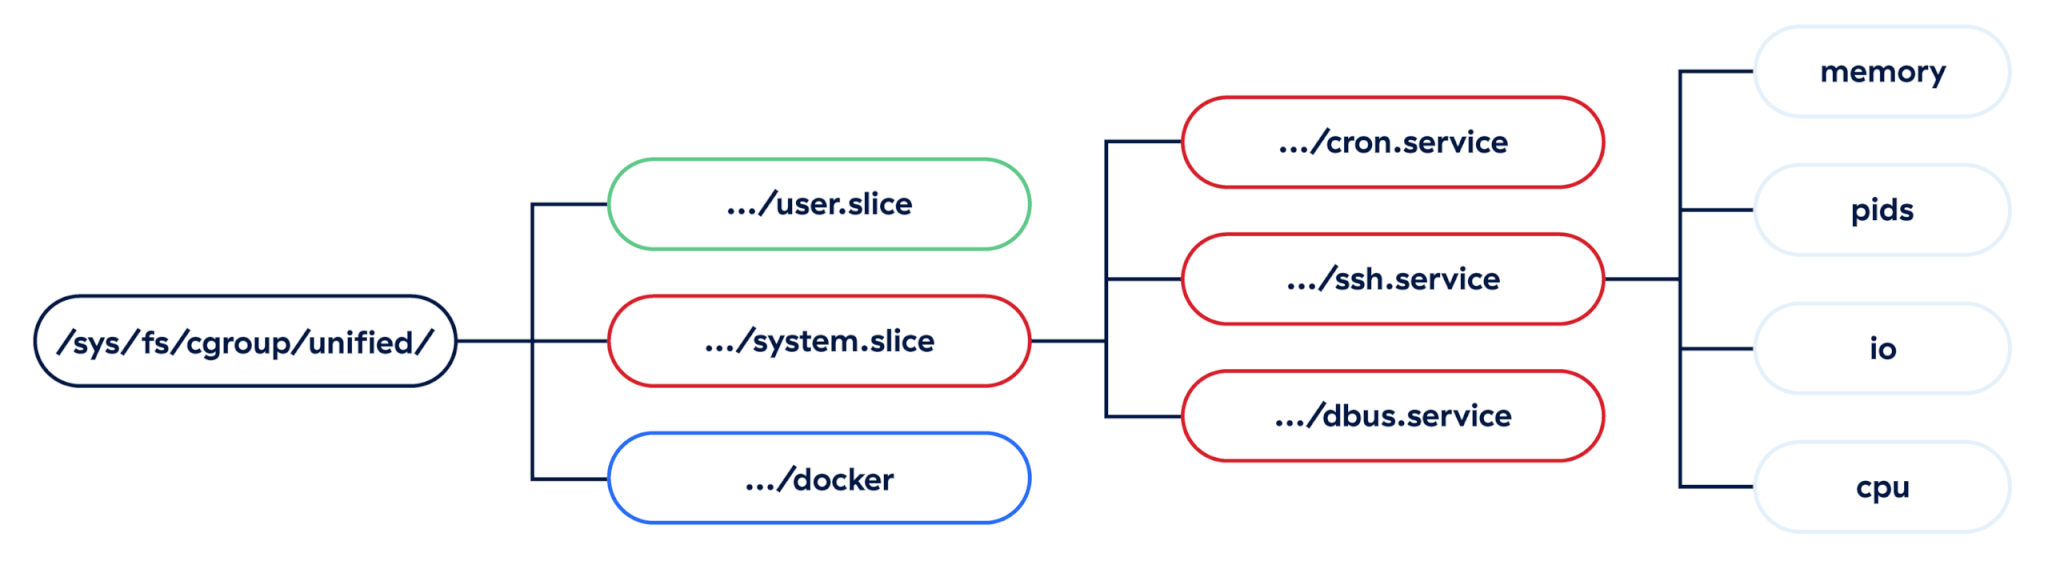
While there are two distinct versions of cgroups, we’ll focus on the more recent version: cgroupsv2. The Linux kernel exposes these cgroups in a unified, nested hierarchy, and each group is applied to individual processes inside the kernel. Defenders can take advantage of this structure to infer a lot of information about malicious or suspicious processes.
Practical uses for cgroups
While cgroups are a kernel feature, they are defined by user space systems in order to manage resources across applications. Let’s look at a couple of examples of real Linux applications that define cgroups for resource management.
systemd
At its core, systemd is an initialization system responsible for starting system services in user space. It’s a replacement for the older SysVinit initialization system, and it takes an expansive view of its responsibilities, which makes systemd very divisive in the Linux community. It has become the de facto init system across almost all major Linux distributions, such as Ubuntu, Debian, Red Hat Enterprise Linux, Arch Linux, etc. In addition to spawning services, systemd also manages the full lifecycle of those services and their dependencies (e.g., device access, logging, network interfaces).
Since systemd is responsible for managing the lifecycle of services, it makes heavy use of cgroups on the backend to ensure those services don’t conflict with each other on a resource level. This is done via .slice and .scope units, which are essentially managed resources for managing resources, and help build out systemd’s internal dependency tree of services.
Note: A “unit” in systemd is like a building block for managing resources
Standard path convention
On a typical Linux server, it is often more important to keep system-level applications running than to keep user-level applications running, so systemd explicitly separates the two, and it uses two main patterns for structuring cgroups depending on which type of application is executing.
Note: The systemd-cgls command can be used to list all active cgroups on a running system.
System-level examples
Cgroups applied to system applications are nested under the system.slice unit and are fairly straightforward—they encode the service or scope name directly under this top level. Any time an attacker creates a systemd service, we can see that service name right in the cgroup at this point. Notably, other systemd units, such as timers, won’t show up in any cgroups since they are irrelevant to limiting resources, so the only malicious units we’re going to see are services, scopes, and slices, with services being by far the most likely of all.
/system.slice/init.scope/system.slice/xeactor.service
User-level examples
Fortunately for defenders, cgroups applied to user-level applications encode even more information about the running process into them. Just like system-level groups, we have a top-level user.slice unit, but each user also gets their own slice of resources, and systemd helpfully encodes the user’s ID directly in this.
When users can spawn their own services, they often make use of something known as a “drop-in” template in systemd, which is just a per-user config file to be applied to all the user’s services. This can be observed in the /user@$UID.service/ section of the path, but it doesn’t give us any other data we didn’t already have. However, just like their system equivalents, those service names can be observed directly in the cgroup path, like in the dbus.service cgroup below:
/user.slice/user-$UID.slice/user@$UID.service/dbus.service
In addition to user-level services, systemd also encodes something very valuable to defenders in these cgroup paths: active user login sessions. Every time a user logs into a server locally or remotely, systemd creates a new session scope, which we can use to surface relationships between processes running inside the same login session. This is very valuable from a forensics standpoint, as it gives us an easy datapoint to collect and increases our confidence that two processes are actually related to one another regardless of the time they spawned or how their process lineage appears:
/user.slice/user-$UID.slice/session-1.scope
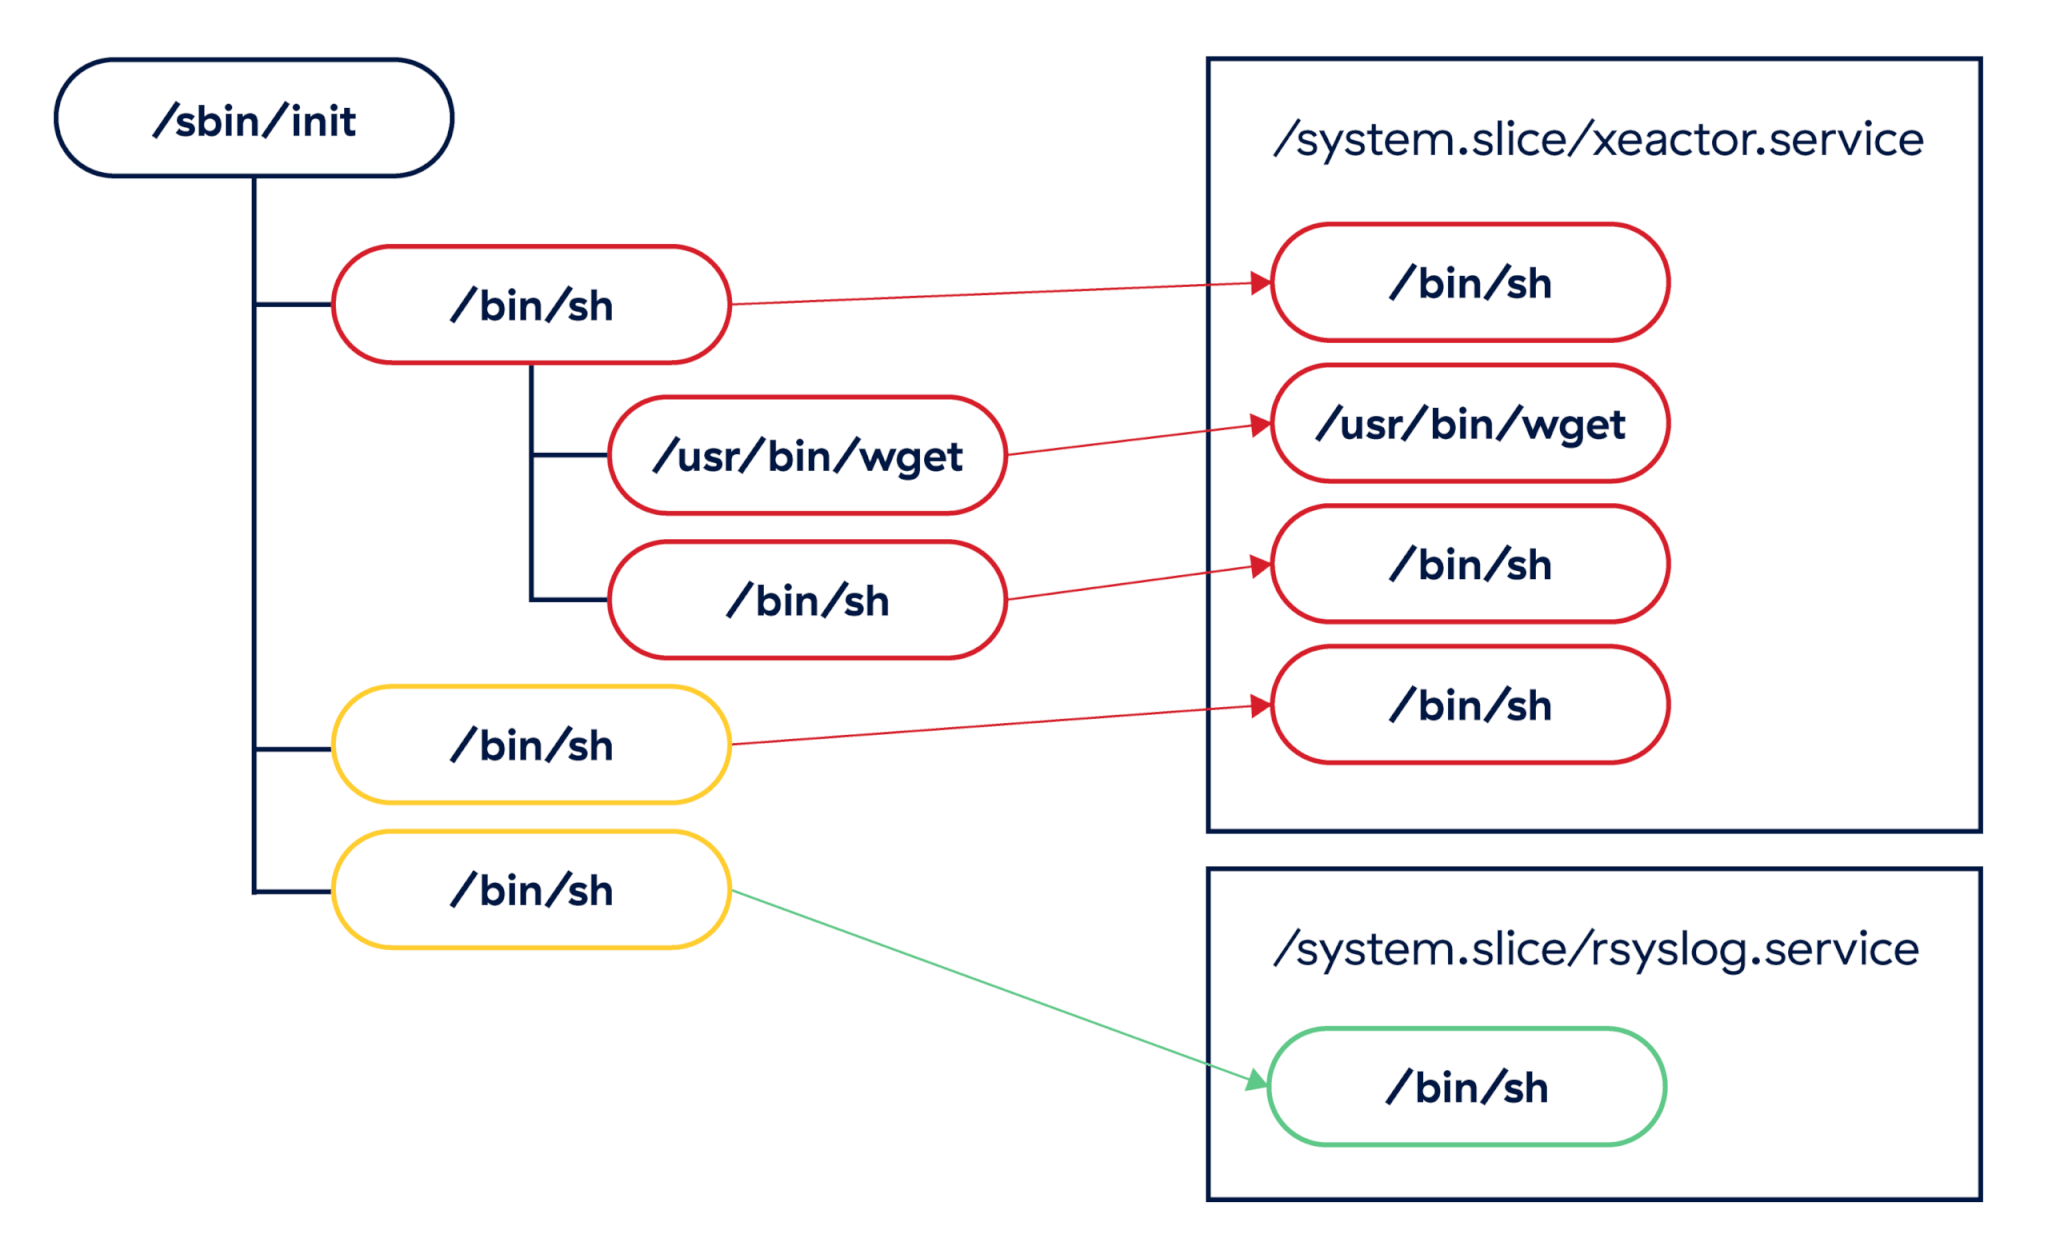
In cases where we have identical process trees, cgroups can be used to differentiate between known malicious services and benign ones. In the example above, the /bin/sh instances run by the xeactor malware could be clearly classified as suspicious based on their cgroups assignment.
Containers and Kubernetes
The other primary case for managing resources on a Linux system is probably better known than Linux itself: containerized applications. Along with namespaces, cgroups define what a container is to the Linux kernel, since the kernel has no understanding of what a “container” is. These are, at their core, just resource-limited and isolated processes, and container runtimes such as (Docker, runc, LXC, etc.) are applications that make defining that isolation easier.
The Open Container Initiative (OCI) provides broad specifications for their standard container definition, including how cgroups are used, but not how they’re created. Since every runtime is able to set up its own cgroup hierarchy, there are slight differences in cgroup paths depending on the runtime being used. For our purposes, we’ll mostly focus on the Docker runtime, with some emphasis on Kubernetes as contrast.
Docker
The Docker runtime sets up very straightforward cgroups, with a single /docker root, and each container ID (typically a long hex string) directly under it. All processes within a container get assigned this same cgroup, and we can use this to quickly group processes together without relying on hooks into the Docker runtime directly.
/docker/$CONTAINER_ID
Example: /docker/2aef0112a7622ac9ba973ccf6ea27f1e
Kubernetes
Kubernetes (or K8s) is a container orchestration system that allows teams to define, deploy, and rebuild their containerized applications via configurations as code. While K8s is extremely popular in the enterprise world, the Linux kernel has no visibility into it.
In addition to the container ID, K8s encodes the pod ID and a Quality-of-Service class into the cgroup hierarchy. While the QoS class is not typically useful for defenders, the pod ID allows us to take this low-level process data and match it to an exact pod definition in our K8s system. K8s uses one of two drivers to actually construct the cgroup paths, with slight differences between them:
- Using the
cgroupfsdriver:/kubepods/$CLASS/pod$POD_ID/$CONTAINER_ID - Using
systemd(notice the “.slice”):/kubepods.slice/kubepods-$CLASS.slice/$POD_ID.slice/$CONTAINER_ID
Examples:
cgroupfs:/kubepods/burstable/pod344aab9758bb0d018b93739e7893fb3a/2aef0112a7622ac9ba973ccf6ea27f1esystemd:/kubepods.slice/kubepods-burstable.slice/344aab9758bb0d018b93739e7893fb3a.slice/2aef0112a7622ac9ba973ccf6ea27f1e
More container runtimes
Each runtime sets its own cgroup format, but broad patterns exist across formats. We’ve collected a non-exhaustive list of cgroups for additional runtimes to demonstrate this:
Runc:/$CONTAINER_IDRunc+systemd:/system.slice/$CONTAINER_IDRunc+systemd+rootless:/user.slice/$CONTAINER_IDPodman+systemd:/machine.slice/libpod-$CONTAINER_ID.scope/containerPodman+systemd+rootless:/user.slice/user-$UID.slice/user@$UID.service/user.slice/$CONTAINER_ID.scope/containerPodman+cgroupfs:/libpod_parent/libpod-$CONTAINER_IDPodman+cgroupfs+rootless:/user.slice/user-$UID.slice/user@$UID.service/user.slice/$CONTAINER_IDK8s+Docker:/docker/$CONTAINER_ID/kubepods/$K8S_CLASS/pod$POD_ID
Investigating with cgroups
Now that we understand how cgroups are used in production Linux systems, we can apply what we know to investigating compromised Linux servers. We’ll use the CNCF Falco tool to generate security alerts and examine its output. Falco describes itself as “a cloud-native security tool that provides runtime security across hosts, containers, Kubernetes, and cloud environments.” It’s free, open source, and easy to deploy on a test environment like ours. Additionally, it supports generating alerts locally or offloading them to an external system like a SIEM or data lake. For our purposes, we’ll just view the alerts locally.
Preparing the environment
The good thing about Falco is that it collects cgroup data out of the box via the execve and execveat syscalls. However, it doesn’t expose this data by default, so we’ll need to make a simple change to its global configuration to ensure this data is added to the outputs of all calls. Simply add a new YAML file to the /etc/falco/config.d/ directory, which adds data from thread.cgroups to text and JSON output:
We’ve put up a GitHub Gist that can be dropped into this directory in a default Falco installation.
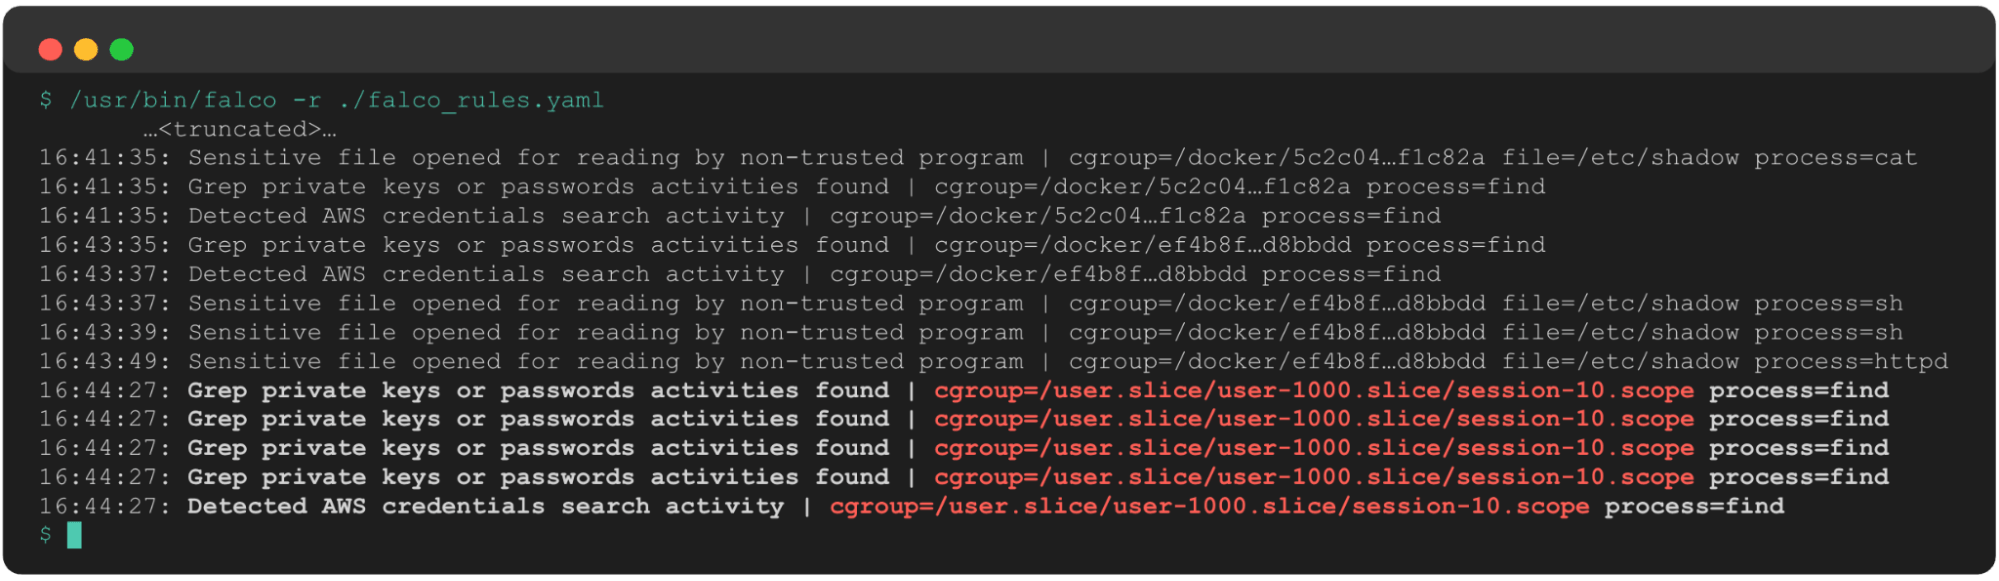
Since we’re using a local Falco instance, we can just execute /usr/bin/falco -r <rules>.yaml and monitor output logs in our terminal window. If, however, we were deploying this on a production server, we would deploy this in a more robust manner, such as via Helm chart in Kubernetes or as a systemd service, and we would collect logs in a centralized place such as a SIEM or data lake.
Reviewing server logs
The first thing we can see when reviewing Falco is that a single container triggered three rules related to credential searching activity:
- Find AWS credentials: Detect attempts to search for private keys or passwords using the
greporfindcommand, particularly targeting standard AWS credential locations - Search private keys or passwords: Detect attempts to search for private keys or passwords using the
greporfindcommand - Read sensitive file untrusted: An attempt to read any sensitive file (e.g., files containing
user/password/authenticationinformation)
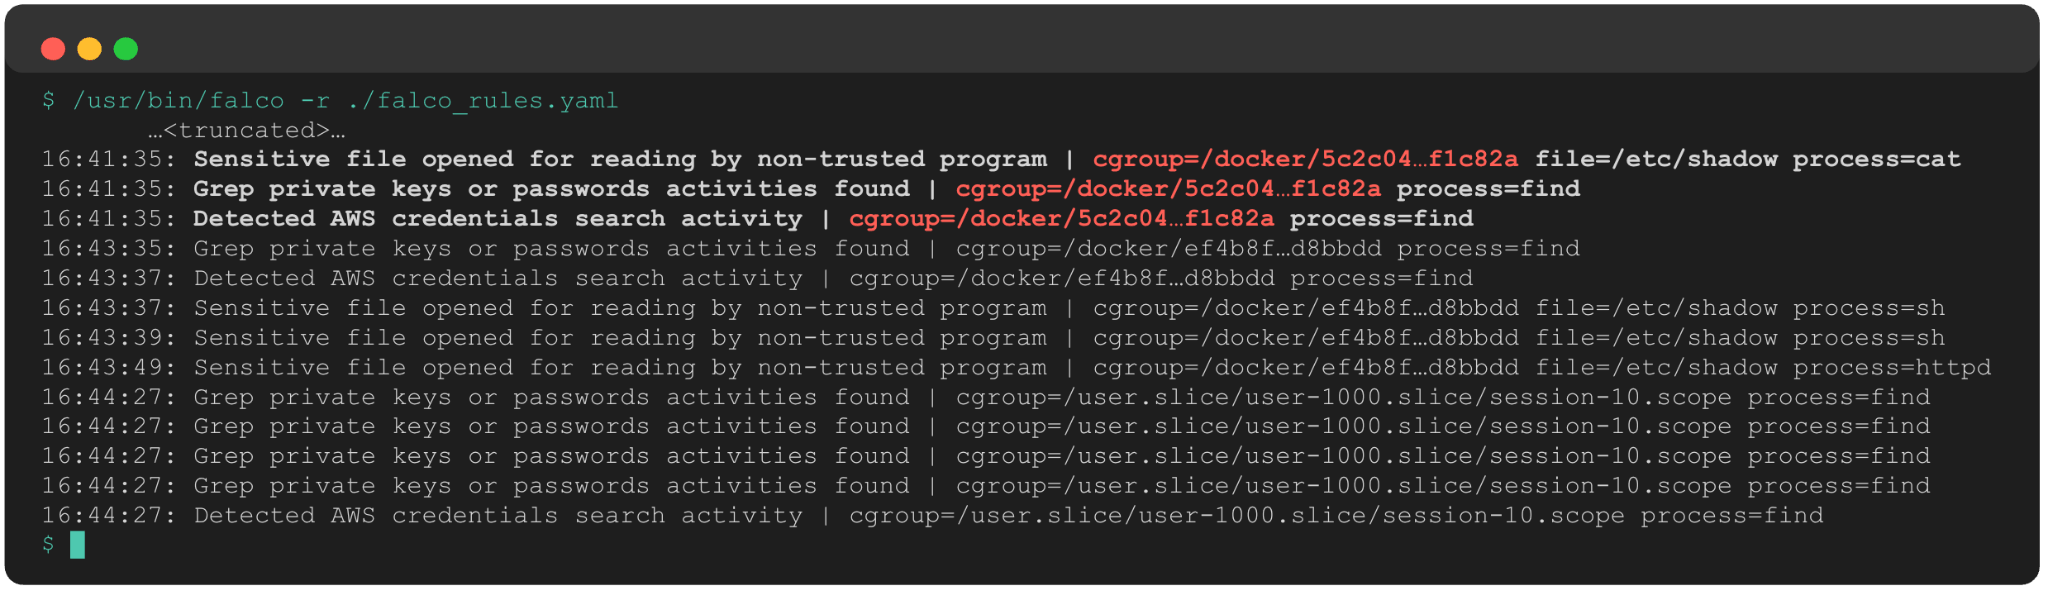
The added cgroup data instantly tells us:
- This is a Docker container.
- The container short ID is 5c2c04.
This instantly gives us a target for further investigation and remediation.
Shortly after these alerts, the exact same set of rules fired on a separate container (ef4b8f). Our response scope has expanded to two containers, which also presents the following questions:
- Are these two containers related in some way, such as in the same Docker swarm or using the same base image?
- Are both of these containers exposed to the internet and, if so, did the same remote connect to both of them?
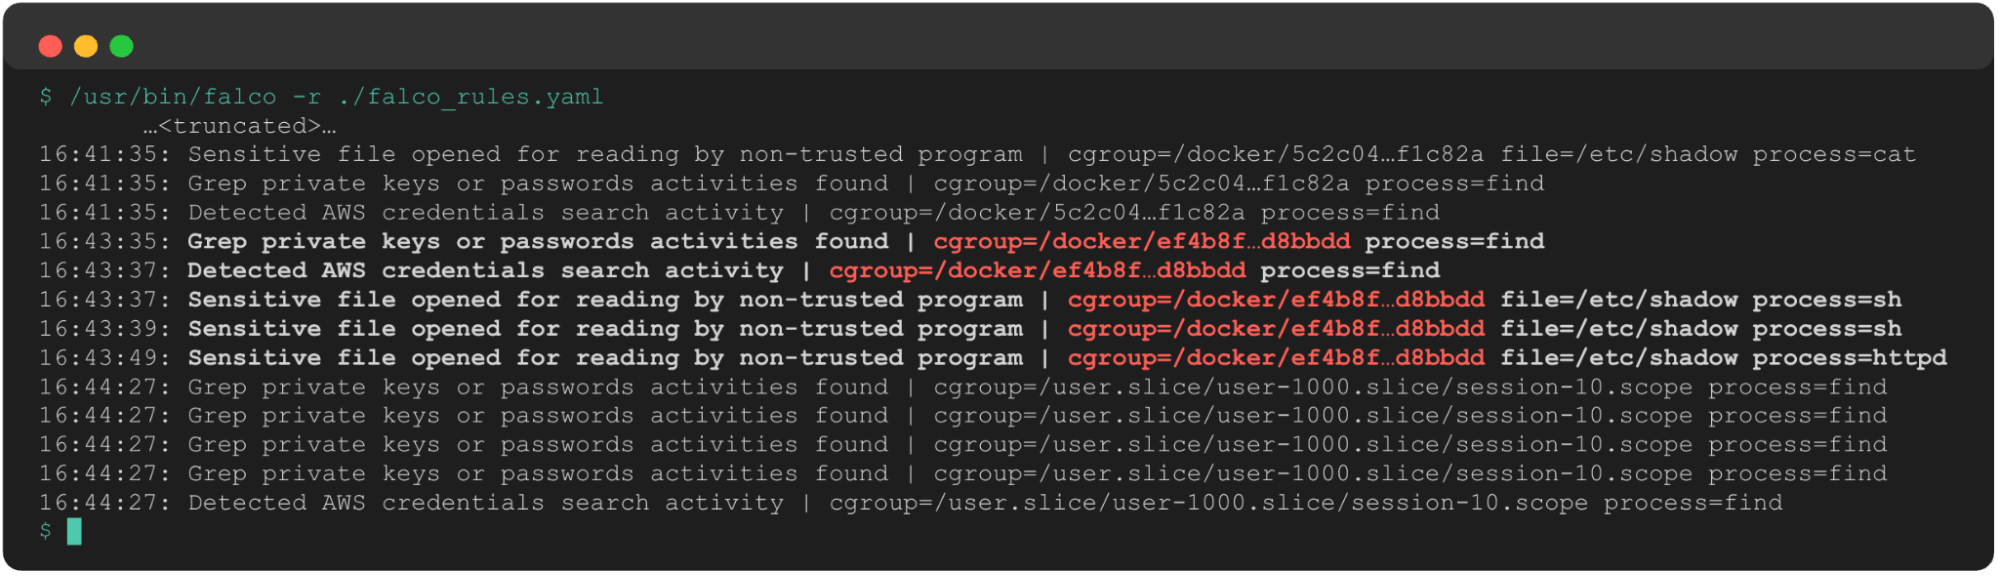
A few minutes later, we see the same alerts fire again. Only this time, thanks to the cgroup’s telemetry and our knowledge of systemd structures, we know this is now on the host system. This new cgroup path shows us UID 1000 is potentially compromised, and their login session 10 is performing suspicious activity that we need to understand in greater detail.
This sequence of events, absent any other information about the processes involved, gives us the following data to begin our investigation:
- Containers
5c2c04andef4b8fare potentially compromised, and any processes spawned by this container are suspect. - There may have been a container escape, due to the progression from two containers to the underlying host.
- The user with
uid=1000is potentially compromised and searching for credentials on the host system. - Any processes in user 1000’s login session 10 are suspect.
We still have quite a bit of work to do to investigate further, but this single type of telemetry gave us quite a head start in that regard, and we now have several leads to follow up on. This ultimately accelerates our response and improves our confidence when scoping an incident.
Detecting with cgroups
Nobody in enterprise security should sit around staring at server logs, waiting for something to happen. High-functioning security teams build detection engineering teams or leverage threat feeds to alert themselves to indicators of compromise in their environments. Focusing on cgroups can help detection engineering teams and SOC analysts drive higher-fidelity detections.
Collecting the data
The easiest method of collecting this data is using a full-featured EDR like Red Canary’s Linux EDR, which collects and surfaces cgroups out of the box. Other endpoint monitoring tools, like the aforementioned Falco, collect cgroups natively, though some configuration is required to surface this data to the SOC.
If you cannot deploy an agent to your production systems, a common restriction, then cgroups can be collected via the pseudo-filesystems in /proc/ or /sys/fs/cgroup, which link individual PIDs to their cgroups. Setting up an inode monitor in either directory and parsing the appropriate file (below) should allow you to collect this data over a period of time without introducing heavy load to your production system:
/proc/$PID/cgroup/sys/fs/cgroup/pids/$CGROUP_PATH/cgroup.procs
We’ve published a POC script written in Golang for doing this yourself—simply download it, run
go build, and view the output in a collection of CSV files.
For more advanced use cases, or if you’re looking to build your own advanced monitoring tool, an eBPF helper named bpf_get_current_cgroup_id() is the route you’ll likely want to go. This helper returns the cgroup associated with the current process being examined. There is also a lookup table, BPF_MAP_TYPE_CGRP_STORAGE, which stores data about active cgroups as well.
Developing detection logic
Now that we have access to the data, we can begin developing detections to take advantage of them. In our experience, this telemetry is best when layered on top of existing detections, which echoes how we use it effectively in security investigations.
In the most straightforward detection use case, we can look for processes with known-malicious cgroup patterns; this essentially uses cgroups as atomic indicators no different than filenames, IP addresses, or file hashes. Some quick examples:
- Arch AUR malware:
xeactor.service - TeamTNT:
sad_service.service - TeamPCP:
sysmon.service - Kimsuky:
syslogd.service
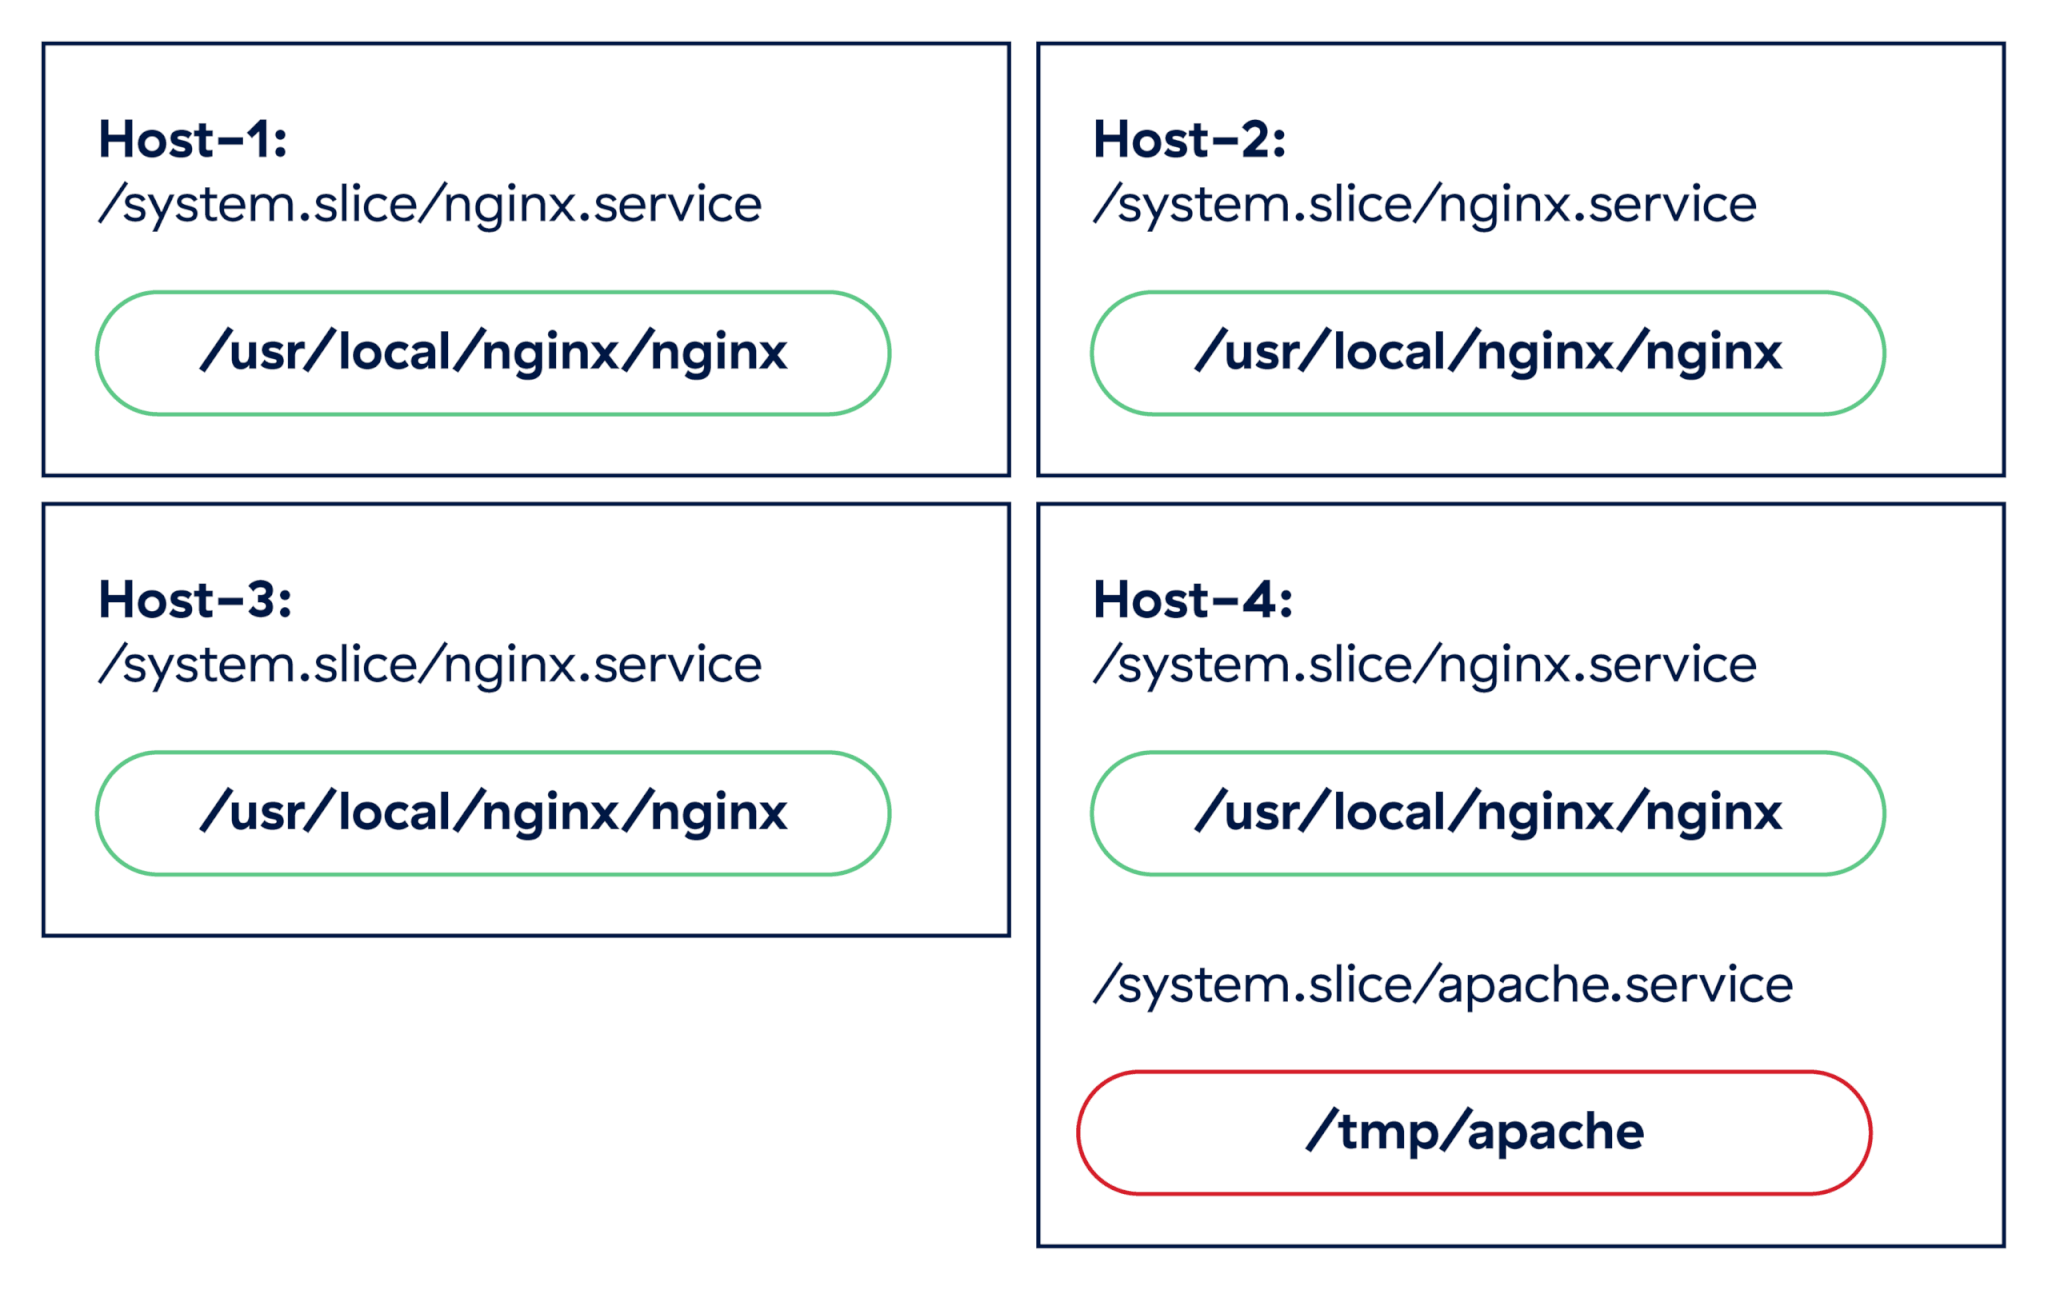
A step up from atomic indicators is simple anomaly detection; periodic surveying of cgroups lets us surface unexpected changes in running processes. For example, if we run a cluster of web servers running nginx, we would expect a consistent set of processes assigned to the /system.slice/nginx.service cgroup. If we suddenly see a different web server show up on a single host in the cluster, such as apache.service, we probably want to start investigating.
It would be unusual for two different web servers to pop up on a single host in a production cluster, and there is no guarantee that the new apache.service cgroup even points to a legitimate server. It could be an attempt by an adversary to blend in to the system using a well-known service name.
The final way we can leverage cgroups in detection rules is by layering this data on top of existing detection logic. Since this data gives us added context about running processes, and it is difficult for adversaries to evade, we can use it to improve our confidence in rules that are prone to false positives, and as a grouping key for alerts firing in a short period of time. When we investigated a potentially compromised host, we didn’t use any rules specific to cgroups, but we were able to infer a lot about the attack by grouping the alerts by cgroup.
Some simple detections that can benefit from this type of grouping include:
- Multiple credential search commands inside the same container (our example)
- Encoded shell command + Python + multiple recon commands within same K8s pod
- The same user login session piping a downloaded file into a shell via
curl
Additionally, we can use cgroup path substrings to improve our true positive rate on a given detection:
- Sensitive file access in a user terminal session that is not
UID 0
Example:/user.slice/user-1000.slice - The wget binary writing a file with a short name to
/tmp/as part of a cron job
Example:/system.slice/cron.service
While cgroups will rarely make for an effective detection on their own, they can really shine when paired with other detection strategies and threat intelligence.
Happy hunting!
Leveraging cgroups during Linux security investigations unlocks a straightforward extension of existing process-based telemetry such as executable paths and command lines, and it provides us with a lot of insight into the context in which a process has spawned. Since cgroups are fundamental to resource management in systemd and necessary for containers to run effectively, adversaries have little choice but to use them when attacking these systems. Defenders can take advantage of this fact to surface relationships between processes even when other telemetry has been obfuscated.
Related Articles
Patching for persistence: How DripDropper Linux malware moves through the cloud