
Network-based telemetry has long been a staple in the cybersecurity professional’s toolkit, and remains so both now and in the future. From the earliest days of intrusion detection systems (IDS) to modern network security monitoring (NSM) platforms, network data provides incredible insight into communications that often have few or no available artifacts from endpoint visibility solutions. Whether using network data alone, or to bolster detection opportunities from other data sources, this perspective is an invaluable one that shouldn’t be overlooked.
What data sources can provide network insight?
Referencing the MITRE ATT&CK Data Source list, no fewer than 13 potential sources could play a part in a comprehensive network visibility solution. While some, such as DS0029: Network Traffic, are obvious contenders, even artifacts from the most minute file artifacts (DS0022) to large-scale infrastructure (DS0030) can be observed in certain network contexts. In many organizations, this evidence already exists as a byproduct of typical business processes. Therefore, using network data alone or to augment observations from other data sources is often a no or low-cost augmentation with a huge potential payoff.
It should also be noted that the placement of network sensors is quite an extensive topic, and not a step in the process that can be dismissed in any way. In that light, you shouldn’t read the lack of coverage in this article as ignorance, but as a fundamental component that would require extensive tuning for each organization and environment.
Types of network evidence
In general, network-based evidence takes one of three main forms:
 Packet capture: This could be as much as 100 percent of the network traffic observed at a particular vantage point in a network environment. However, the sheer volume of traffic, as well as common legal hurdles to collecting this data, can hinder or altogether preclude its strategic or proactive collection. However, in an incident response capacity, it may be advantageous to collect tactical packet capture with a focused scope to acquire the network traffic of a single compromised host or a smaller enclave of the environment where an adversary is known to be operating. In either mode of collection, packet capture can quickly get to massive volumes and may incur legal considerations that require careful non-technical consideration in addition to the technical ones.
 Flow summaries: Flow summaries (colloquially “NetFlow”) are statistical summaries of communications that have occurred in the past. By definition, these have no content—as compared to full packet capture above. In fact, a flow summary is a simple record that contains metadata about a communication, including corresponding endpoints (IP addresses and ports), layer 4 protocol (such as TCP or UDP), packet/byte counts, etc. While this is an inherently incomplete source of network telemetry, it does provide extremely fast insight into what might have originated as incredibly large network communications.
 Log data: While perhaps not the most obvious choice for network data, logs are also among the most familiar forms. In fact, logs hold some unique potential in terms of evidence of network activity: they are more likely to exist in even a small environment, they contain numerous protocol artifacts, and they are generated at the endpoint–meaning they are almost universally plaintext even when documenting artifacts from protocols that are encrypted while in flight.
Between these three broad categories, there are thousands of individual potential sources of data that can provide network-focused insight. Whether the environment has a traditional on-premises footprint, a cloud-first or cloud-only deployment, or a hybrid between the two, network data is both abundant and useful to detection operations and incident response investigations.
The first two of these categories are specifically captured in MITRE’s DS0029: Network Traffic data source and represent the most commonly identified sources of network telemetry. Additionally, log data contains selected artifacts from the original network traffic, so in a sense this category is an extension of traffic capture as well. However, below we’ll explore some of the more nuanced data sources that can be acquired from network traffic.
Why network telemetry matters
Part of what makes network data so valuable to security professionals is that once network evidence is created, it’s incredibly difficult to truly erase. This means that network evidence is a durable and generally reliable means of examining adversaries’ actions. Where more cautious and deliberate adversaries may be effective in covering their tracks through scrubbing logs on a compromised system, fully concealing the existence of network activity is much more difficult. While it’s also true that traditional network observability is decreasing as encryption becomes more ubiquitous, most encrypted communications still have two primary telemetry opportunities:
- There are still valuable artifacts from the pre-encrypted negotiation phase of most encrypted communications.
- The use of cloud-based and on-premises TLS intercepting forward and reverse proxies provides plaintext visibility into many typical enterprise communications.
Detection (and enrichment!) opportunities 

Now we’ll take a closer look at some specific network telemetry and its artifacts, along with how those observations can support common situations in today’s attack landscape. Note that in all samples used, identifying information such as IP addresses, host names, user account names, and the like have been redacted and DO NOT include any real-world operational details.
Additionally, these are just some broad examples of how some forms of network evidence can be used—in practice there are practically infinite variations on what fields a web server’s access log may contain. In some environments, systems may be far too high-traffic to generate meaningful traffic summaries or packet capture collections. In most cases, these constraints can be balanced by focusing more intensive (and therefore expensive) visibility on the highest-priority resources or business areas. While it’s cliche to say that every environment is a unique snowflake, there is certainly truth behind that adage. These examples are certainly not a “one size fits all” solution.
DS0038: Domain Name
DNS information is perhaps some of the most valuable network data, since it is a common protocol that underpins nearly all other network protocols, associating human-friendly hostnames to machine-native IP addresses. Therefore, it is an excellent way to get a solid understanding of the network environment as a whole. Further, there are numerous ways to correlate hostnames to IP addresses, making DNS analysis a broadly applicable skill. In fact, any data that includes a clear association between a hostname and an IP address can be considered DNS source data. Below is an example of a subset of fields from Zeek’s dns.log files, across several records.
{"id.orig_h":"192.168.75.28","id.resp_h":"91.11.62.6","query":"c2.evil.org", "answers":["101.202.75.18"],"TTLs":[58]}
{"id.orig_h":"192.168.75.28","id.resp_h":"91.11.62.6","query":"c2.evil.org", "answers":["75.19.51.1"],"TTLs":[41]}
{"id.orig_h":"192.168.75.28","id.resp_h":"91.11.62.6","query":"c2.evil.org", "answers":["203.61.173.56"],"TTLs":[18]}These records reflect a specific adversary technique called “fast flux” DNS, in which the apparent IP address for an adversary-controlled resource such as a command and control (C2) server is obscured behind numerous rapidly changing IP addresses.
- The low “TTL” values reflect that the records should not be retained in any DNS cache for longer than the number of seconds indicated. Low TTLs alone are not a guarantee of a fast-flux architecture but combined with other behaviors, can be a good indicator of this concerning behavior.
- Zeek’s
id.resp_hfield is their terminology for the destination IP address, or what we’d typically call the “server.” In this case, the external IP address could be cause for alarm—especially if the environment is properly configured to use internal DNS resolvers and not random internet-based ones. - While we don’t always have the benefit of obviously sketchy hostnames like
c2.evil.org, the presence of any hostname opens up the opportunity for additional enrichment such as recency of domain registration, baselining domain or host-level activity in the environment, lookups with trusted reputation services, and more. - Depending on the observation time of each of these entries, the rate of change over time could itself be a useful detection opportunity—especially when combined with the other points above.
DS0037: Certificate

Certificates are used during the pre-encryption negotiation process for TLS (and legacy SSL) encrypted communications. At this time, these are still passed in plaintext, allowing inspection and logging of many of their important fields. Below is an entry from Zeek’s x509.log file in JSON format, which includes several useful fields.
{"ts":1698101872.187273,"fingerprint":"4558b07b30154f7044db6613f3d92e9f4cd0fb7740f8b0e5dc099d78a4a5807d","certificate.version":3,"certificate.serial":"0200038734C06AFA94267D50A6DF6EAC","certificate.subject":"CN=resource.redcanary.com,O=Cloudflare\\, Inc.,L=San Francisco,ST=California,C=US","certificate.issuer":"CN=Cloudflare Inc ECC CA-3,O=Cloudflare\\, Inc.,C=US","certificate.not_valid_before":1680393600,"certificate.not_valid_after":1712015999,"certificate.key_alg":"id-ecPublicKey","certificate.sig_alg":"ecdsa-with-SHA256","certificate.key_type":"ecdsa","certificate.key_length":256,"certificate.curve":"prime256v1","san.dns":["resource.redcanary.com"],"basic_constraints.ca":false,"host_cert":true,"client_cert":false}- Perhaps most important is the serial number, which is a unique value for each certificate authority (CA, a.k.a. issuer). This makes the serial number an ideal value to search for to find instances of fast flux DNS architectures or other load-balanced infrastructures.
- The certificate’s subject, which indicates the host name(s) it is authorized to represent, can provide a great DNS correlation point. Especially with the advent of various forms of encrypted DNS, this may be one of the last plaintext associations of DNS names to IP addresses. In modern certificates, the subject is in two fields, the subject name itself as well as the subject alternative name, or SAN. For a really advanced take on these, consider comparing the certificate subject’s name to the corresponding DNS traffic to identify mismatches. If a DNS hostname doesn’t match the certificate subject name, this could be an indicator of a technique called “domain fronting.”
- The CA itself is also useful, as it is often a common touch point for an adversary who uses a consistent CA for multiple operations. (However, the proliferation of LetsEncrypt! as a free and automated CA has been a boost to security for the good people on the internet, it’s also become frequently used by adversaries as well.) In this example, the CA is Cloudflare, a common content delivery network (CDN). In certain contexts, this could be a useful artifact, as red teams and true adversaries alike are known to use CDNs to mask their own infrastructure.
- Lastly, the validity period is also included. In this log format, the “Not Valid Before” and “Not Valid After” fields are reflected in UNIX epoch time format. In this case, the values reflect that the certificate is valid from 2023-04-02T00:00:00Z to 2024-04-01T23:59:59, or a one-year period. Time ranges of 90 days to one year are typical and modern browsers generally reject any certificate valid for longer than 13 months.
DS0022: File
 This data source is quite varied within itself, and generally refers to any filesystem-level artifacts that are often the cornerstone of digital forensics. This may first feel at odds with the “network” topic, but when looking at the protocol functionality of networked filesystems, there is significant overlap between the two. This is because what a local filesystem standard like NTFS, EXT4, or XFS provides for locally accessing file contents, a networked file system such as SMB or NFS must also provide between two networked systems. Therefore, most or all of the local artifacts must also exist in network traffic, which opens the possibility for observation and/or logging.
Below is an example of the rich artifacts present in SMB 3.1.1 traffic as reflected in a packet capture viewed with Wireshark.
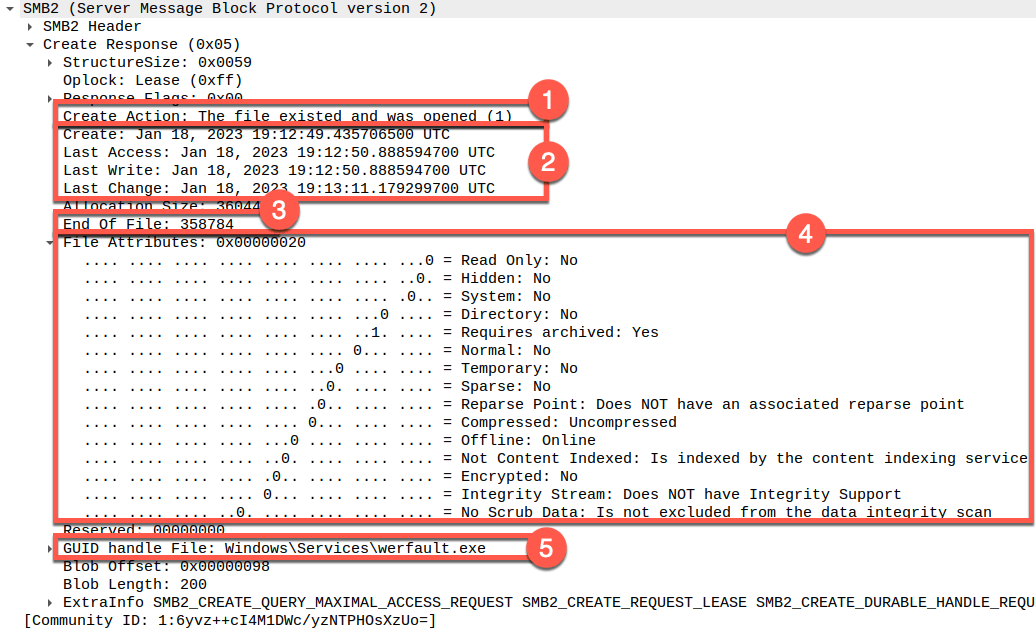
This screenshot reflects just one of several SMB protocol messages that contain a wide variety of rich artifacts most commonly associated with forensic filesystem analysis.
- Confirmation that the file existed and the previously authenticated user account has permission to access it.
- The telltale “MACB” timestamps, which are associated with every file and directory on an NTFS filesystem. These indicate the time at which specific file-based activity occurred with regard to the specific file being accessed. (For the NTFS experts out there, these reflect the
$STDINFOtimestamps.) - The file size, in bytes.
- Filesystem attributes.
- The filename itself. (The filename request first occurs much earlier in the SMB conversation, but is displayed here for conciseness.)
Of particular note is that these filesystem-level details also open up opportunities for crossover with other “Better Know a Data Source” topics such as Process Creation, Process Command Line, and (soon to be published) File Modifications.
Lastly, the nature of SMB and some other network file system protocols is that “everything is treated like a file,” creating the opportunity for crossover with other data sources such as DS0023: Named Pipe and DS0033: Network Share. Since actions behind those sources use the same network messages for remote process execution, share browsing, and more.
DS0035: Internet Scan 

Scanning for vulnerabilities is a practice almost as old as the internet and remains a clear indicator of adversary reconnaissance and potentially the interests and opportunities they choose to pursue. Two great examples of this activity come from NetFlow as well as server log data.
Date first seen       Duration   Proto   Src IP Addr:Port     Dst IP Addr:Port  Packets  Bytes Flows
2023-08-29 13:58:55.809   00:00:00.000 TCP  123.150.207.231:38553 ->   98.252.16.36:3306     1    44   1
2023-08-29 13:58:56.217   00:00:00.000 TCP  123.150.207.231:38553 ->   98.252.16.36:587     1    44   1
2023-08-29 13:58:56.626   00:00:00.000 TCP  123.150.207.231:38553 ->   98.252.16.36:53      1    44   1
2023-08-29 13:58:57.037   00:00:00.010 TCP  123.150.207.231:38553 ->   98.252.16.36:443     2    84   1
2023-08-29 13:58:57.045   00:00:00.000 TCP    98.252.16.36:443  -> 123.150.207.231:38553    1    44   1
2023-08-29 13:58:57.437   00:00:00.003 TCP  123.150.207.231:38553 ->   98.252.16.36:5900     2    84   1
2023-08-29 13:58:57.438   00:00:00.000 TCP    98.252.16.36:5900 -> 123.150.207.231:38553    1    44   1
2023-08-29 13:58:57.840   00:00:00.000 TCP  123.150.207.231:38553 ->   98.252.16.36:1720     1    44   1
2023-08-29 13:58:58.250   00:00:00.000 TCP  123.150.207.231:38553 ->   98.252.16.36:1723     1    44   1
2023-08-29 13:58:58.652   00:00:00.000 TCP  123.150.207.231:38553 ->   98.252.16.36:993     1    44   1
2023-08-29 13:58:59.053   00:00:00.000 TCP  123.150.207.231:38553 ->   98.252.16.36:8080     1    44   1
2023-08-29 13:58:59.455   00:00:00.000 TCP  123.150.207.231:38553 ->   98.252.16.36:445     1    44   1
2023-08-29 13:58:59.856   00:00:00.000 TCP  123.150.207.231:38553 ->   98.252.16.36:1025     1    44   1
2023-08-29 13:59:00.261 00:00:00.000 TCP 98.252.16.36:3389 -> 123.150.207.231:38553 1 44 1Above is an example of typical port scanning activity conducted against IP address 92.252.16.36, consistent with techniques adversaries use for service discovery. These NetFlow results clearly show that communications were short (no measurable duration), low-volume (a single, 44-byte packet in most cases), and with varying destination port numbers at the target, all of which are associated with well-known services. Ports TCP/443 and TCP/5900 were found to be open, as indicated by the presence of the response NetFlow records and increased packet and byte counts.
Another example comes from web server logs. Often, adversaries will perform reconnaissance against public-facing web servers by searching for vulnerable web applications at their known or default paths.
123.150.207.231 - - [30/Aug/2023:09:18:58 +0000] "GET //phpMyAdmin-2.2.3/scripts/setup.php HTTP/1.1" 404 310 "-" "-"
123.150.207.231 - - [30/Aug/2023:09:19:11 +0000] "GET //phpMyAdmin-2.6.0-rc1/scripts/setup.php HTTP/1.1" 404 314 "-" "-"
123.150.207.231 - - [30/Aug/2023:09:19:12 +0000] "GET //phpMyAdmin-2.6.0-rc2/scripts/setup.php HTTP/1.1" 404 314 "-" "-"
123.150.207.231 - - [30/Aug/2023:09:19:12 +0000] "GET //phpMyAdmin-2.6.0-rc3/scripts/setup.php HTTP/1.1" 404 314 "-" "-"
123.150.207.231 - - [30/Aug/2023:09:19:13 +0000] "GET //phpMyAdmin-2.6.0/scripts/setup.php HTTP/1.1" 404 310 "-" "-"
123.150.207.231 - - [30/Aug/2023:09:19:14 +0000] "GET //phpMyAdmin-2.6.0-pl1/scripts/setup.php HTTP/1.1" 404 314 "-" "-"
123.150.207.231 - - [30/Aug/2023:09:19:36 +0000] "GET //phpMyAdmin-2.8.0-rc1/scripts/setup.php HTTP/1.1" 404 314 "-" "-"
123.150.207.231 - - [30/Aug/2023:09:19:37 +0000] "GET //phpMyAdmin-2.8.0-rc2/scripts/setup.php HTTP/1.1" 404 314 "-" "-"
123.150.207.231 - - [30/Aug/2023:09:19:38 +0000] "GET //phpMyAdmin-2.8.0/scripts/setup.php HTTP/1.1" 404 310 "-" "-"
123.150.207.231 - - [30/Aug/2023:09:19:38 +0000] "GET //phpMyAdmin-2.8.0.1/scripts/setup.php HTTP/1.1" 404 312 "-" "-"
123.150.207.231 - - [30/Aug/2023:09:19:39 +0000] "GET //phpMyAdmin-2.8.0.2/scripts/setup.php HTTP/1.1" 404 312 "-" "-"
123.150.207.231 - - [30/Aug/2023:09:19:40 +0000] "GET //phpMyAdmin-2.8.0.3/scripts/setup.php HTTP/1.1" 404 312 "-" "-"
123.150.207.231 - - [30/Aug/2023:09:19:40 +0000] "GET //phpMyAdmin-2.8.0.4/scripts/setup.php HTTP/1.1" 404 312 "-" "-"
123.150.207.231 - - [30/Aug/2023:09:19:41 +0000] "GET //phpMyAdmin-2.8.1-rc1/scripts/setup.php HTTP/1.1" 404 314 "-" "-"
123.150.207.231 - - [30/Aug/2023:09:19:42 +0000] "GET //phpMyAdmin-2.8.1/scripts/setup.php HTTP/1.1" 404 310 "-" "-"
123.150.207.231 - - [30/Aug/2023:09:19:42 +0000] "GET //phpMyAdmin-2.8.2/scripts/setup.php HTTP/1.1" 404 310 "-" "-“The example below shows sequential requests for a web application’s default URI. While all of these were for nonexistent resources and therefore failed (indicated by the 404 response code), the remote actor clearly shows an interest in the target host—especially given that this activity is from the same source IP address as the port scanning activity noted above.
DS0019: Service
Creating and maintaining inventories of an operational environment is a critical component of even the most nascent security programs. One of those inventories lists the active services, or processes listening for inbound communications. This helps establish a solid understanding of the attack surface exposure, which can drive proactive controls as well as incident response actions. Again, looking at Zeek logs, one of those it creates is known_services.log, which contains entries for each observation of a system responding to an inbound request—even if the system functions in a “headless” mode with no human action needed to put it into operation.
{"ts":1698163213.795012,"host":"192.168.20.1","port_num":53,"port_proto":"udp","service":["DNS"]}
{"ts":1698169613.151506,"host":"192.168.20.1","port_num":67,"port_proto":"udp","service":["DHCP"]}
{"ts":1698171099.13138,"host":"192.168.20.1","port_num":443,"port_proto":"tcp","service":["SSL"]}
{"ts":1698185700.511245,"host":"192.168.47.189","port_num":80,"port_proto":"tcp","service":["HTTP"]}As seen in this sample, the log includes helpful details such as the apparent server’s IP address, port number, and application-layer service observed. This log data is collected passively, without any active scanning for services. Therefore, it represents services actually accessed rather than a comprehensive attack surface inventory.
DS0002: User Account
Logs showing user account activity are also a valuable data point to feed additional investigative avenues. The account names themselves can be used to identify rogue or otherwise unauthorized account usage and attempts, but additional details in most log events can add important network context as well.
2023-06-19T02:29:12.325818+00:00 ftp01 -2023-01-16 19:27:25 178.11.91.64 FTP01\hawkeye 172.16.10.12 21 RETR archive.7z 550 4294967295 0 212cb731-09d9-458a-a545-ddac00b492fc /users/hawkeye/archive.7z#015
2023-06-19T02:41:21.153059+00:00 ftp01 -2023-01-16 19:38:06 22.126.94.145 FTP01\hawkeye 172.16.10.12 21 PASV - 227 0 0 725c269b-7008-4681-b6a3-784fac059b2b -#015
2023-06-19T02:41:21.153059+00:00 ftp01 -2023-01-16 19:38:06 22.126.94.145 FTP01\hawkeye 172.16.10.12 51555 DataChannelOpened - - 0 0 725c269b-7008-4681-b6a3-784fac059b2b -#015
2023-06-19T02:41:21.153121+00:00 ftp01 -2023-01-16 19:39:17 22.126.94.145 FTP01\hawkeye 172.16.10.12 51555 DataChannelClosed - - 0 0 725c269b-7008-4681-b6a3-784fac059b2b -#015
2023-06-19T02:41:21.153121+00:00 ftp01 -2023-01-16 19:39:17 22.126.94.145 FTP01\hawkeye 172.16.10.12 21 RETR archive.7z 226 0 0 725c269b-7008-4681-b6a3-784fac059b2b /Users/hawkeye/archive.7z#015These entries show two FTP login sessions, which both used the hawkeye user. The first session resulted in an unsuccessful download attempt (due to the 550 response code), while the second was successful (226 response code). However, the user account is now associated with two different IP addresses within the same relatively short period of time. If this activity was associated with an adversary’s actions, the user account would be an obvious lead to follow.
Conclusion
It’s no secret that I am a huge proponent of network forensics and the evidence that enables that practice. That certainly extends to proactive defense and security operations activities as well. Whether used alone—or as is much more likely and more useful—alongside other cybersecurity disciplines, a network perspective can provide invaluable insight to the overall landscape of our industry.
References
Related Articles
MSIX and other tricks: How to detect malicious installer packages
Emu-lation: Validating detections for SocGholish with Atomic Red Team