
A long time ago, in a land far away, there lived a shim detector. The shim detector monitored data coming from Endpoint Detection and Response (EDR) platforms, watching for modifications to certain registry paths. It did its job well, but unfortunately it made so much noise that analysts didn’t want to listen to what it had to say.
So What’s a Noisy Little Detector to Do?
To set the stage for our story, it’s important to have some background on how Red Canary’s detectors work. We start with broad detection coverage and narrow the focus as we go; we want to ensure that our detectors are broad enough to catch the things we don’t yet know about explicitly, while maintaining enough focus to reduce noise levels (because we don’t want “alert fatigue” creeping up on our analysts). In some cases, we start with a premise, and break one detector into several so that we can identify activity from many different angles. This not only increases our granularity for tuning, but also for suppression or whitelisting; all without reducing visibility.
In the case of our little shim detector, the registry paths being modified were all tied in with the Microsoft Application Compatibility Infrastructure (ACI), which is all about a patching (“shim”) process that can be used to help legacy applications run on the “current” version of Windows. This has been around for several generations of Windows OS, and is absolutely brilliant from an application longevity standpoint; it’s basically just an indexed binary database that stores information about compatibility issues, and the related code to “fix” or shim them.
The challenge to defenders and incident responders is that these shims can be applied dynamically to non-legacy applications, even core (privileged) Windows processes. In memory. With very little trace. One word for you: Carbanak. That is the reason for the noisy little shim detector: to find malicious activity related to application shimming.
MITRE has some good information about the technique in their ATT&CK framework, under Technique T1138 – Application Shimming. For convenience, here’s an excerpt via their API:
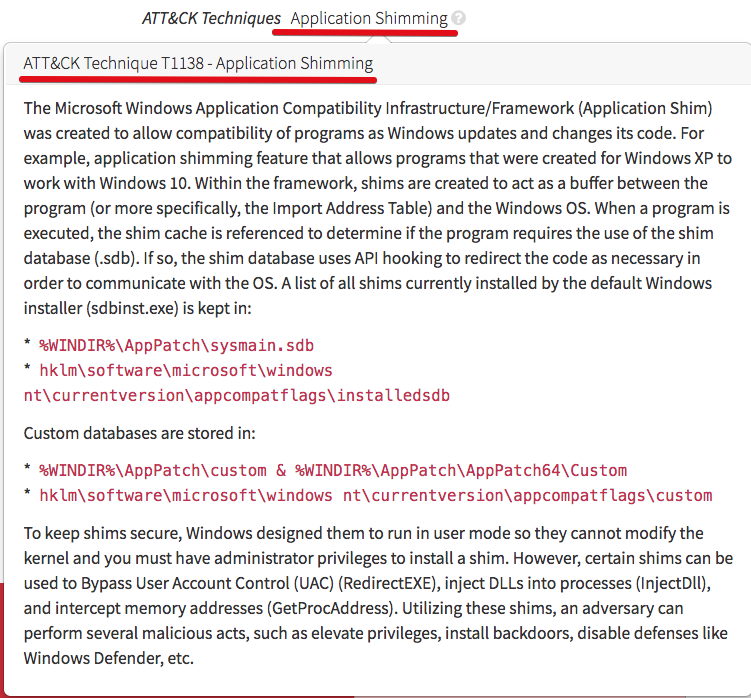
Just from that description, it should be fairly obvious that this topic has substantive depth. When I first encountered an event from our erstwhile detector, my primary question was: “How does a registry modification indicate an evil application shimming attack?” The challenge there is that in order for registry modifications to be of value, you have to be able to parse the registry and see the actual changes being made. This is not commonly available in EDR telemetry, which is more about execution-related activity.
So while our little detector did work (and worked proliferously), it identified that registry modifications occurred all the time. But it didn’t put us in a position to efficiently ascertain whether evil was occurring, and it was difficult to exclude certain non-threat activity via whitelisting. The time had come to learn more about application shimming and attacks leveraging the technique to help our little detector become more effective.
Stoking the Fire
After some research and internal discussion, we updated the detector to monitor for the creation of SDB files. This helped reduce the noise somewhat, but didn’t account for legitimate applications writing SDB files during normal installation processes. We needed to grab the shovel and put some coal in the firebox!
We had an upcoming “team off-site” to work through various items and challenges, so I took up the task of doing an internal presentation on our ability to detect malicious shimming via the ACI. Most of the research I found pointed to Carbanak, and was along the lines of post-compromise DFIR activities involving memory analysis, binary reverse-engineering, and other detailed “dead box” analysis. There was good information out there, but it really needed to be massaged for use with EDR data, and for use as part of an early-stage detection strategy.
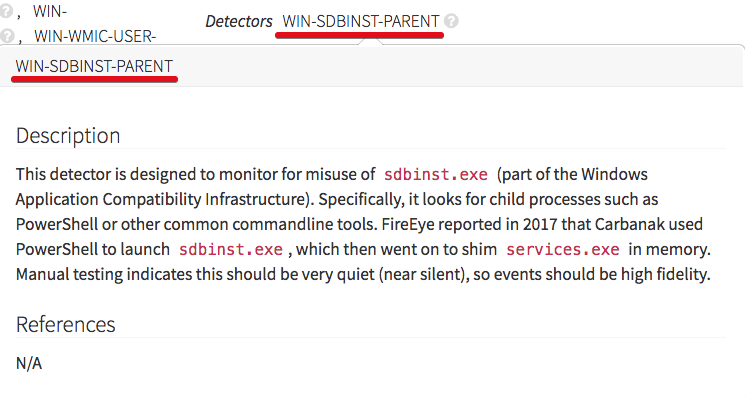
We ended up with a detector focusing on behavior around the execution of sdbinst.exe, the primary ACI process. Was sdbinst.exe launched in a normal manner? Did it spawn suspect processes or take other suspect actions? What SDB files did it create? These approaches would combine capabilities with the rest of our detectors, all designed to flag other suspect binaries or activity. We needed a holistic view that took into account combinations of behaviors rather than static or computed indicators; that’s the thing that would increase fidelity and help analysts zero in on true malicious activity. But would it be effective? Internal testing indicated that it would, and we stoked that engine’s fire!
Mapping Detectors to MITRE ATT&CK
A great opportunity arose as we started mapping detectors over to the MITRE ATT&CK matrix. If you read our recent article on mapping detectors to MITRE ATT&CK techniques, then you have some insight into this process. (And if you haven’t read it, you should!) Part of that process involves building and publishing methods to test how attacks can actually take place— independently of our detector coverage. This takes us to Atomic Red Team, a suite of tests we’ve covered extensively on our blog and social media. As our researchers put application shimming to the test, the analyst team got to see it firsthand.
Here is the activity we observed:
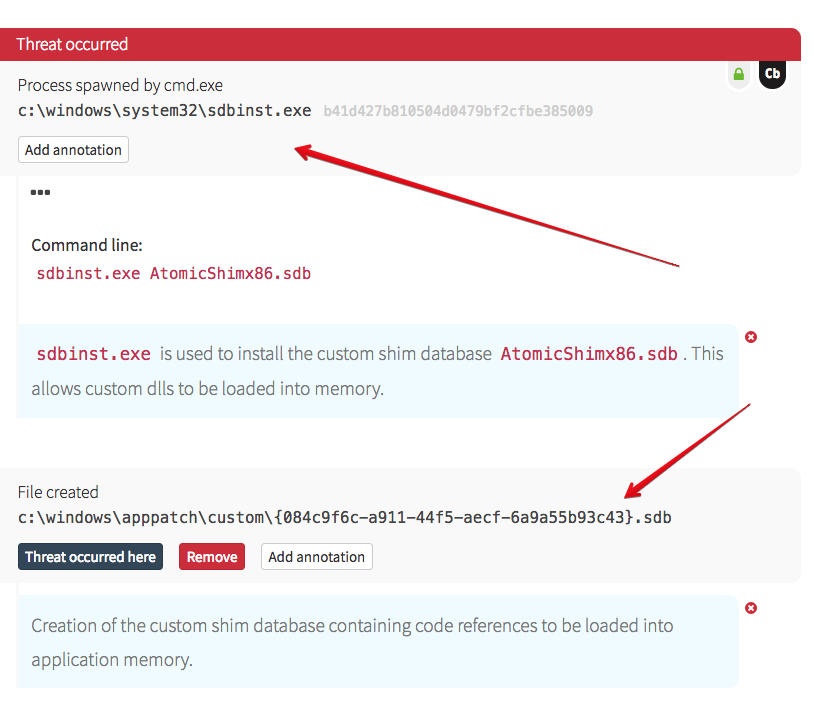
The testers created a custom shim database and saved it to disk. If you recall from the earlier ATT&CK screenshot, the path to the SDB file is fairly standard (although the code instructions contained therein may not be!). In order for an attacker to leverage the ACI in this way, they have to utilize an SDB file, so that’s one aspect for detection. Also note that the Command Processor (cmd.exe) was parent to sdbinst.exe.
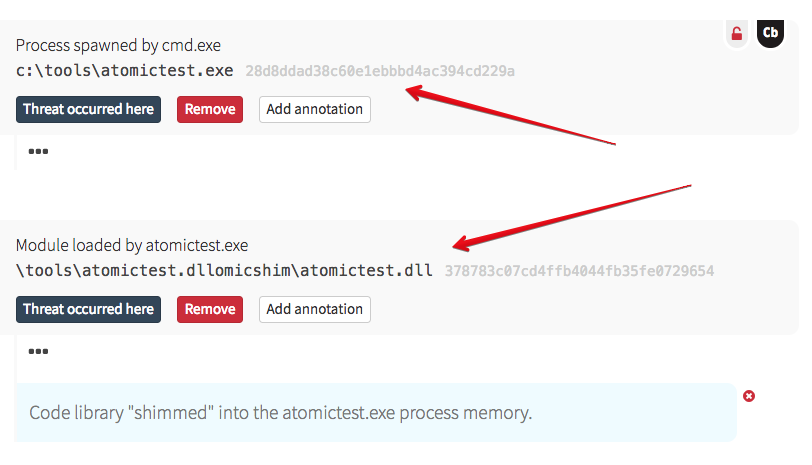 Next up was to launch a binary and have code shimmed into its memory, to take action accordingly. The exact methods and end results may differ, but the overall process should generally be the same. Our researchers created a custom binary to utilize; in the case of Carbanak, the attackers leveraged PowerShell to launch sdbinst.exe and create their custom SDB file. That allowed them to shim code into the Services Control Manager (services.exe, a privileged process) to execute a backdoor.
This is different than a cross-process injection, as – from an attacker perspective – you’re not interacting with running code, grabbing a remote thread, and working your way into process memory. Instead, via the instructions stored in the shim database, the designated process is patched – in memory – on execution. As a result, nothing happens until the process is restarted; this can be allowed to occur naturally, or triggered via some other mechanism (for instance, a scheduled task). As long as that SDB instruction remains, the shimming will occur every time the process launches.
You don’t have the footprint of cross-process injection. If you’re shimming a privileged process, that binary isn’t changed on disk, so hash and signature remain intact and trusted. All in all, it’s another stealthy attack vector, and good to detect as early in the chain as possible. That requires more than just detection methodologies, but also analysts who understand how the attack may be approached.
Detecting an Application Shimming Attack
In general, these are the different aspects or steps of an application shimming attack:
- Compilation of code to be patched into application memory; this is typically a DLL file, but could be virtually anything. This code is written to the target system, but doesn’t “do” anything at that point.
- Creation and registration of a shim database (SDB file) on the target host, leveraging the ACI framework (sdbinst.exe).
- Restarting system or single process in order to get the referenced code inserted into process memory.
- Winning!
This is also virtually identical to the approach an admin will take to patch a legacy application, or that many installers do by default to avoid completely rewriting old code. So how do you know what is evil vs good? Some of it will stand out, once the behavior is examined, but in some cases it may be a bit more obscure.
Here are different types of activity that can be useful to raise behavior for further review:
- Registry modifications: Look for registry modifications indicating that an SDB file has been registered with the system via sdbinst.exe. EDR platforms can collect this telemetry, but without the ability to parse the details of those changes, is fairly high-noise, low-fidelity.
- Creation of SDB files on the host: This data is easily collected by EDR, but also high-noise and low-fidelity. Of more interest are files created under the user profile or other nonstandard locations, or by suspicious processes (not an installer, msiexec.exe, etc).
- Execution of sdbinst.exe under suspicious circumstances: Commonly observed during installs as a child of msiexec.exe, this can also legitimately occur in other ways. Watch for commandline utilities launching it instead. This tends to be low-noise, high-fidelity.
- Event logs: If you have the ability to parse and combine event logs with the rest of your telemetry, interesting data should be contained in the Microsoft-Windows-Application-Experience-Program-Telemetry.evtx logs.
When activity is raised that combines these—perhaps in conjunction with other behaviors such as suspicious PowerShell or WMIC—these are no longer viewed as isolated IOCs because the fidelity increases dramatically. And that puts us on the right track.
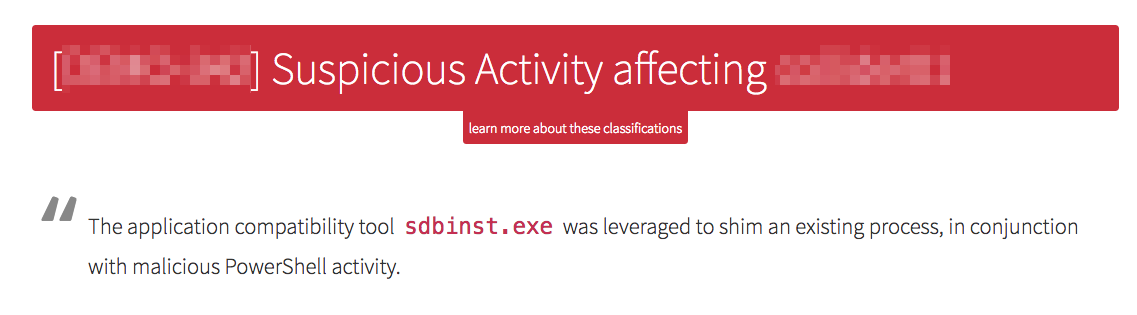 Because of the hard work of our little shim detector, we were able to validate that yes, it could indeed raise event data related to malicious application shimming. And analysts knew what they were looking at. I just love it when a plan comes together!

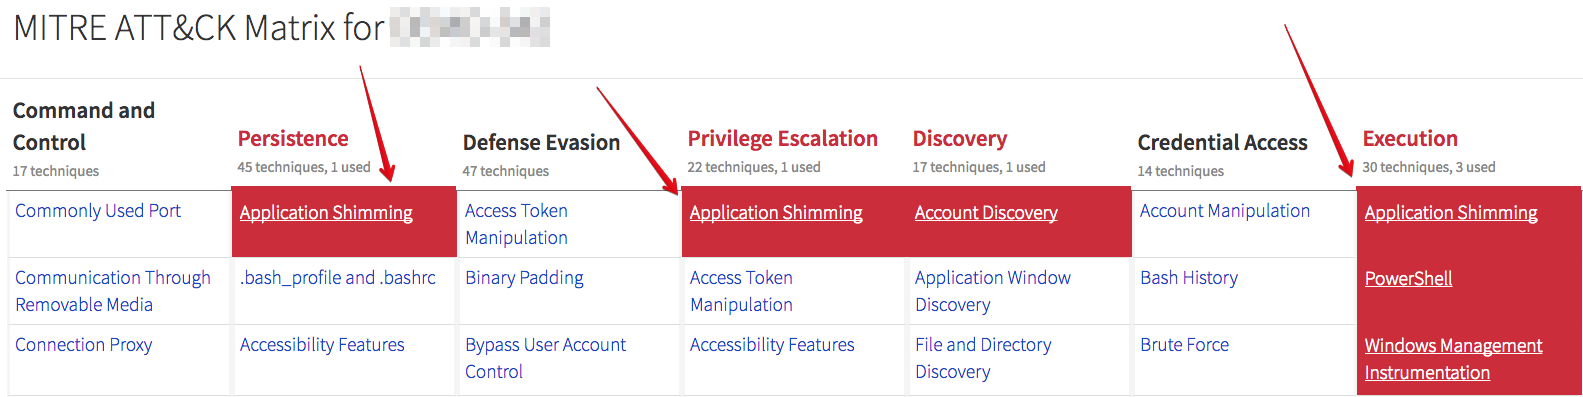
To tie in with our MITRE ATT&CK mapping, we can see the observed tactics identified in different ways. Each of the items marked with ‘1’ below link to MITRE’s description of the attack technique; that was shown back in the beginning of this post.
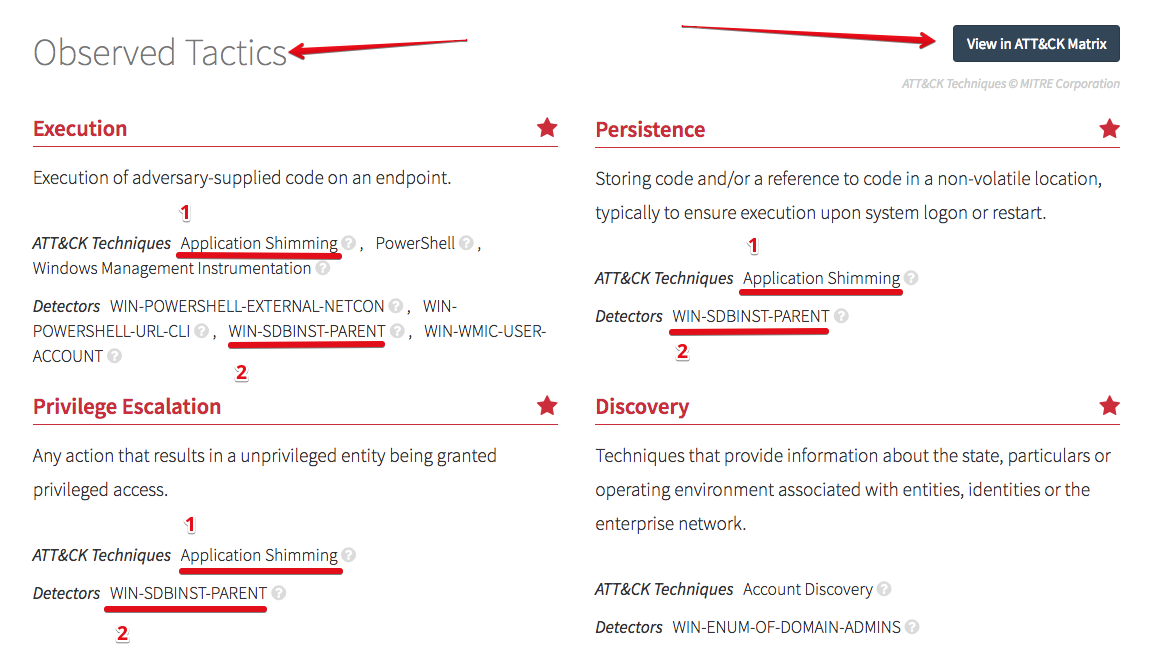
The items marked as ‘2’ provide a description of what type of activity that detector raises to our analysts; that is shown in the following image:
Finally, the “View in ATT&CK Matrix” button opens that view to show overall tactic coverage. All of these are provided in the detection that goes out to our customers.
I hope you’ve enjoyed this story of the little detector that could. First it couldn’t (very effectively) detect application shimming; now it can. In fact, the detector has since been split into multiple detectors (roughly a dozen), each focusing on different methods by which application shimming can be leveraged during an attack. This has occurred “organically” as we work to improve the efficiency and effectiveness of our detection capabilities, and will continue to do so to identify new threats and scale to meet our customers’ needs.
Read this next: Red Canary ATT&CKs (Part 1): Why We’re Using ATT&CK Across Red Canary
Related Articles
Stay on top of GitHub vulnerabilities with Dependabot Configurator