
Red Canary provides managed detection and response (MDR) for the “big three” public cloud vendors: Amazon Web Services (AWS), Microsoft Azure, and Google Cloud Platform (GCP). Cloud environments can host all sorts of workloads that run on machines where installing an agent is impractical (for example, serverless environments like AWS Lambda or wholly managed services like Azure Key Vault). To monitor and protect those workloads, what we need is the telemetry from the cloud control plane. As our CTO Chris Rothe put it, this gives us:
“… everything everyone did to the cloud control plane, every resource they created, every resource they stopped, every security group they modified. That’s what’s in that telemetry.”
“Cloud control plane” is a vendor-agnostic term we use to have conceptual conversations about our products and services without needing to dive into the details of a particular implementation. However, from an implementation, operational, or security perspective, those vendor-specific details are critically important, and vary wildly between each vendor. Today we’ll be focusing on Microsoft Azure, so let’s dive into some of those details, and how Red Canary provides a high quality MDR service for our cloud customers.
Just a quick side note before we start: cloud computing is complex, and each public cloud provider has their own unique perspective and terminology. If you want or need additional information on the specifics of Microsoft Azure, we’ve linked to each Azure service the first time it’s referenced. Additionally, this primer on Azure fundamentals describes the high level of how accounts, tenants, subscriptions, and resources are all related.
Azure logging
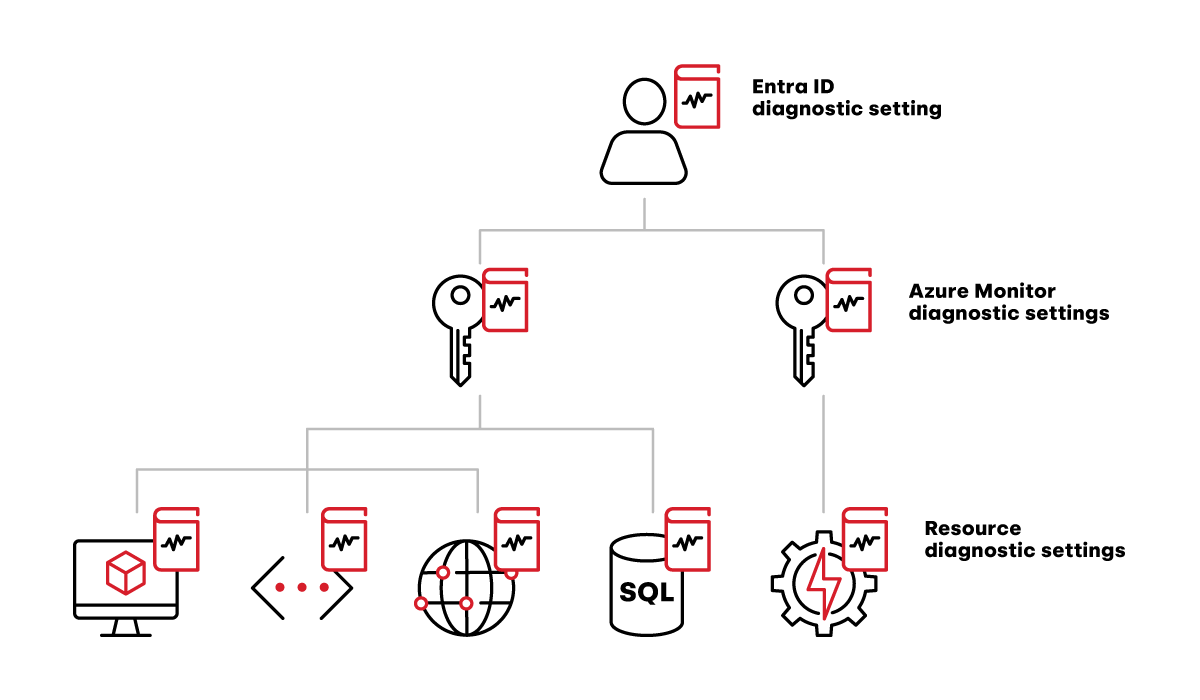
Azure has three sources of logs that we care about in the context of MDR: Entra ID (formerly known as Azure Active Directory), Azure Monitor, and various resources.
Entra ID logs cover the identity and access management (IAM) activity for the entire tenant. That means they contain both authentication activity (i.e., who logged in when and from where) and audit activity (e.g., user X just granted the Global Admin role to user Y). Red Canary’s detection engine and security engineers use these logs to find suspicious activity, but just as importantly, these logs provide crucial context when analyzing whether some suspicious activity is truly malicious.
Azure Monitor logs are subscription-level (as opposed to tenant-level for the IAM logs), and contain almost everything a user or service might do through the Azure Portal, PowerShell, az command line tool, or REST API. This is the bulk of the logging that we care about, as it contains everything from spinning up a new VM to granting public access to a storage account.
Resource logs are a large category that includes multiple sources, since these are logs emitted by the individual Azure services that run the actual workloads. For instance, the storage account service will log all read, write, and delete events. This category of log source is particularly challenging to collect and analyze. We’ll unpack some of those challenges below.
For all of these sources, logging is not enabled by default. It must be explicitly enabled by creating a diagnostic setting on the log source. For the IAM logs, that means creating a diagnostic setting on the Entra ID tenant. For the Azure Monitor logs, that means creating a diagnostic setting on every subscription inside the tenant. For resource-level logs, that means creating a diagnostic setting on every instance of every service you want to monitor. For environments that are provisioned through automated tooling such as Azure Resource Manager templates or Terraform, this is relatively easy to manage. For environments that allow manual provisioning, Azure provides tools that can ease the burden somewhat, which we’ll cover below.
All the diagnostic settings Red Canary needs to create
When a diagnostic setting is created to capture logs, two pieces of configuration are required: the “category” of logs to collect and the destination where the logs should be sent. The category options are unique depending on the source, but usually include an “all” option that is appropriate in most situations. However, be mindful of the categories you select on services with a high volume of events. For instance, if you enable the “read” category for a storage account that’s part of a frequently queried data lake, your Azure bill is going to notice.
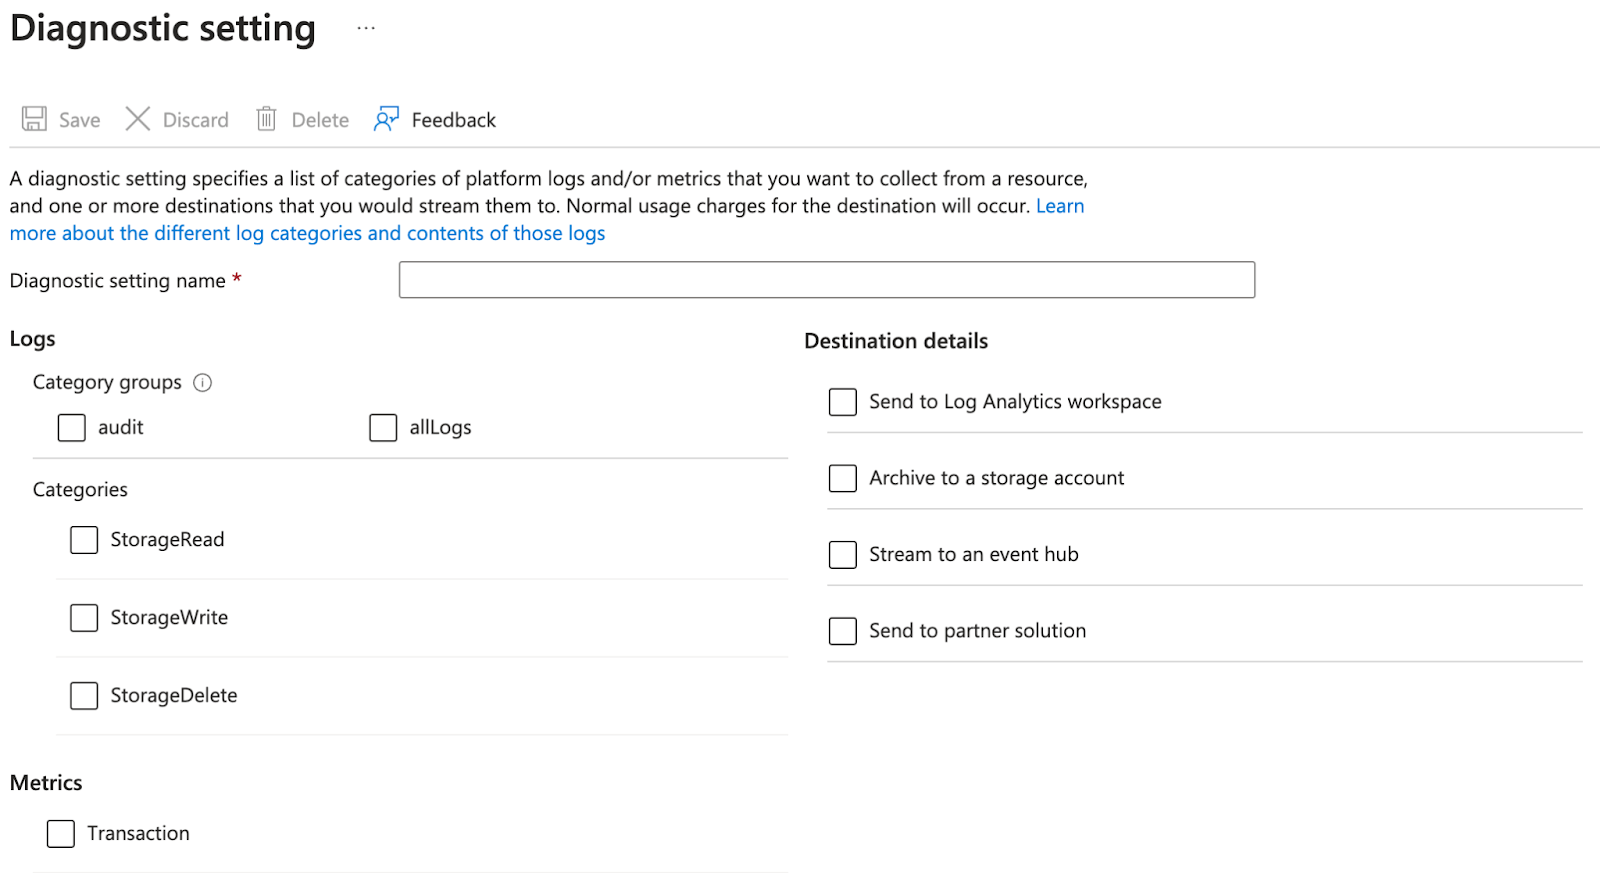
Adding a diagnostic setting to a storage account
While the source categories are unique, the destination options are always the same:
- Send to Log Analytics workspace
- Archive to a storage account
- Stream to an event hub
- Send to partner solution
Send to partner solution is a fantastic option if you’re working with one of the infrastructure monitoring companies that Microsoft supports as a partner.
Archive to a storage account is also a fantastic option for compliance or offline analytics use cases. The logs are only exported once each hour, but storage accounts are flexible and relatively inexpensive.
Send to Log Analytics workspace is the best choice for most use cases. The Log Analytics Basic tier provides free ingest for Azure Monitor logs, a robust query interface, and the ability to seamlessly upgrade for more advanced features. It is also possible to configure export rules to stream most log categories to other services.
For advanced use cases, Stream to an Event Hub is the catch-all solution. It works for all log categories from all log sources, but it does have some limitations:
- It requires provisioning (and managing) an Event Hub.
- For resource logs, the Event Hub must be in the same region as the resource.
- For Entra ID logs, the Event Hub must be part of the Entra ID Tenant (i.e., no cross-tenant Event Hubs for Entra ID).
- It’s only part of a solution; something else needs to collect the logs from the Event Hub before you can do anything useful with them.
Unfortunately, Microsoft Azure does not provide an out-of-the-box solution for cross-tenant logging that works for all log sources. For the solution we’ve built, Red Canary uses a combination of Log Analytics workspaces and Event Hubs. Below, we’ll dive into the how and why.
Solution design
In order to provide MDR services to any customer, regardless of the type of environment, we need to:
- Give the customer the simplest onboarding experience possible
- Collect the relevant logs quickly and cost-effectively
- Analyze the collected logs for any suspicious activity
For Microsoft Azure, each of these objectives poses unique challenges.
Objective 1: Onboarding
Cloud environments are particularly powerful and fantastically flexible. And with that power and flexibility comes crazy complexity. One of our primary goals when designing our Azure integration was making the onboarding process simple and easy for our customers, without sacrificing the flexibility necessary to support that crazy complexity.
In order to collect logs from a customer, we need to establish a trust relationship between their environment and our environment. Azure provides a multitude of options for managing cross-tenant trust relationships. After much trial, error, and frustration, we settled on using Azure Lighthouse. With this solution, we can provide customers a single bicep file and Azure CLI command that creates two Azure Policy documents that grant us all of the access we need. This is super simple for customers that want us to monitor their entire environment, since they can configure everything with a few clicks and a copy/paste into Azure Cloud Shell. And customers with more complicated environments or use cases have the flexibility to customize how and where our Lighthouse offer is applied to meet their unique needs.
Objective 2: Log collection
As mentioned above, we use a combination of Log Analytics workspaces and Event Hubs for the actual log collection. Unfortunately, Log Analytics workspaces don’t support exporting all of the log categories we need to monitor for our customers. We also don’t want to ask customers to provision (and manage) dedicated Event Hubs just to send us their logs. By hosting the Event Hubs ourselves in Red Canary’s tenant, we can simplify onboarding and shoulder all of the ongoing maintenance burden. We can also reduce the overall cost by using a shared pool of auto-scaling compute resources rather than needing dedicated resources for each customer.
However, since Entra ID does not support cross-tenant log exports for any destination option, we use a Log Analytics workspace in the customer tenant to collect the Entra ID logs. From there, we configure a data export rule to send those logs on to the Event Hubs running in Red Canary’s tenant.

How log data flows between the various diagnostic settings
Creating the actual diagnostic settings to enable the log export is where things get tricky. We have some customers with hundreds of subscriptions in a single Entra ID Tenant. Not to mention all of the individual resources inside those subscriptions. That’s a lot of diagnostic settings to manage. For customers that already use an infrastructure-as-code solution, this isn’t a big deal. But designing a solution that only works for those customers would create a poor experience for everybody else.
Microsoft recommends using their Azure Policy service for solving this exact problem. They have built-in policy definitions that will verify all existing resources have been configured with a diagnostic setting, and that will automatically create a diagnostic setting on any new resources when they are provisioned.
We use Azure Policy as part of our default onboarding flow to automatically apply our Azure Lighthouse offer to any new subscriptions when they are created. We’ve found it works great for this use case. Unfortunately, it does not work for creating diagnostic settings for cross-tenant exporting. Remediation tasks, which are the feature in Azure Policy that handles creating any missing diagnostic settings, always execute as a managed service account. For cross-tenant export, that managed service account needs access in the customer tenant to create the diagnostic setting, and it needs access in Red Canary’s tenant to write to our Event Hubs. In our testing, we found that configuring cross-tenant permissions for a managed service account is not possible. Boo.
Since we can’t use Azure Policy, our solution for managing the plethora of new diagnostic settings was to request a few extra permissions in our Azure Lighthouse offer, then automate everything using Microsoft’s REST APIs.
In our Azure Lighthouse offer, we request the following roles:
var RCTenantAuthorizations = [
  {
    // Log Analytics Contributor - can read all monitoring data and edit monitoring settings, including configuring Azure diagnostics on all Azure resources.
    roleDefinitionId: '92aaf0da-9dab-42b6-94a3-d43ce8d16293'
  }
  {
    // Reader - View all resources, but does not allow you to make any changes.
    roleDefinitionId: 'acdd72a7-3385-48ef-bd42-f606fba81ae7'
  }
]
Once a customer applies our Lighthouse offer to one of their subscriptions (either manually or using Azure Policy), that gives us the access we need to configure the log exports. From there, it becomes a state synchronization problem.
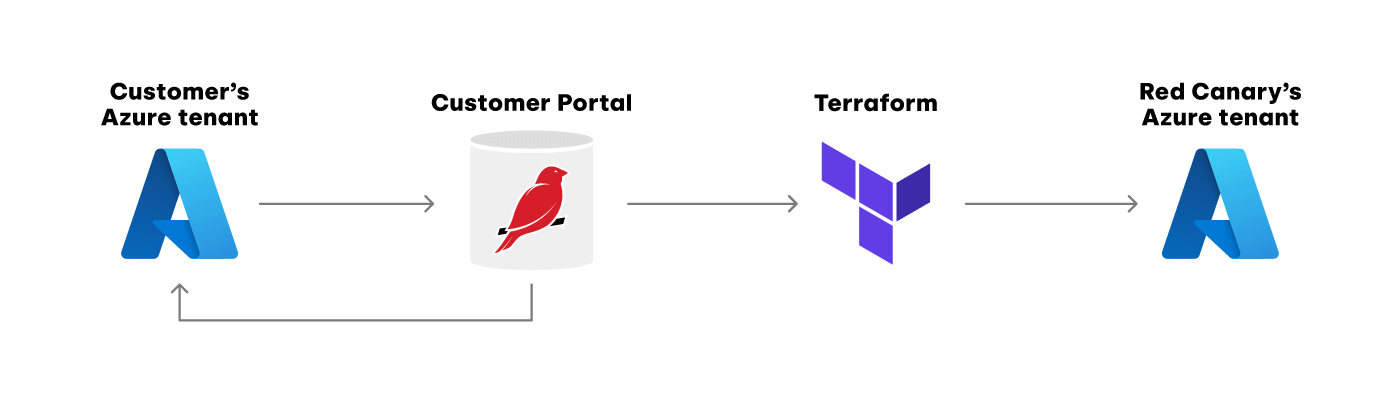
All the places we need to keep state information synchronized
We need to pull the current list of subscriptions and resources from the customer tenant, and sync that with our portal so our customers can validate that they’ve configured everything correctly on their end. From there, we need to sync the customer’s region information into Terraform so we can create the necessary Event Hubs in our tenant. And once that is done, we need to reach back into the customer’s subscriptions to create the diagnostic settings to actually export the logs.
This kind of state synchronization problem is a common one for Red Canary, and we’ve tried several patterns for solving it in the past. Because our core application is written in Ruby on Rails, one tempting option is to use active record callbacks to run a synchronization job whenever a customer creates or updates their Azure integration. This simple approach does work, but job failures and race conditions from overlapping jobs can both lead to the state getting out of sync.
Our current approach to solving this problem is to break it down into a series of idempotent and self-healing steps, each scheduled and executed using Sidekiq periodic jobs. Any inconsistencies due to transient errors or race conditions are automatically reconciled by the next job run.
Here are the steps we run to synchronize everything:
- Get a list of every customer subscription we can access, then save it to our primary database
- For every customer subscription in our database, use our Log Analytics Contributor access to ensure a diagnostic setting exists
- For every customer subscription in our database, use our Reader access to get a list of every resource that we need to monitor, then save it to our database
- For every customer resource in our database, use our Log Analytics Contributor access to ensure a diagnostic setting exists
- For every tenant a customer has configured in our database, use our Log Analytics Contributor access to make sure the associated Log Analytics workspace has a data export rule that sends us Entra ID logs
- Using the list of customer resources in our database, determine which subscriptions have resources running in which regions, and provision the matching Event Hubs in our tenant
For each of these steps, we prevent sudden spikes in system utilization by using a parent job with a job offset utility to spread the load out over time.
module AzureLogIngest
  class GlobalAzureSync
    sidekiq_options queue: :cloud_account_sync, retry: false

    def call
      schedule_subscription_state_sync
      # ... other schedule_* methods
    end

    def schedule_subscription_state_sync
      count = azure_integrations[:azure_subscription].count
      azure_integrations[:azure_subscription].each_with_index do |integration, index|
        integration.customer_subdomain.with_database do
          offset = job_offset(count: count, index: index, interval: 5.minutes)
          AzureLogIngest::SubscriptionStateSync.call_in(offset, integration: integration.id)
        end
      end
    end
  end
end
The last step in our synchronization list is slightly more complicated than the others, and it deserves some extra explanation.
At Red Canary we use Terraform to provision all of our production infrastructure, including the Event Hubs we use for collecting Azure logs. For most of our infrastructure, our engineers write the Terraform HCL files by hand to match the requirements of the project. In this case, we need our Event Hub infrastructure to be more dynamic, responding to changes as new customers onboard and existing customers expand their cloud footprints. That means we need our Terraform configuration for these Event Hubs to be automated.
For situations like this, we write a background job that generates the dynamic configuration then commits it to a private repository on GitHub. From there, Terraform Cloud’s auto-apply feature handles updating our running infrastructure. Every time our background job updates the Terraform configuration, it updates the configuration for all customers at once, which makes our background job idempotent and self-healing.
This pattern allows our dynamically generated and manually crafted infrastructure configurations to live side-by-side, and lets us use the same auditing and tracing tools for both. This is handy in the rare cases where something goes wrong and we have to untangle what happened.
For our Azure Event Hubs, because we need an Event Hub in every region where our customers run infrastructure, our generated Terraform file looks something like this:
locals {
  event_hub_mapping = {
    "brazilsouth" = [
      "customer1"
    ]

    "centralus" = [
      "customer1",
      "customer2"
    ]

    "italynorth" = [
      "customer2"
    ]
    # ... etc
}
Then, in a custom Terraform module, we transform that concise data structure into two new data structures that Terraform’s for_each argument understands:
locals {
  # List of all Event Hub regions.
  # Example result:
  #   event_hub_regions = ["eastus", "eastus2"]
  event_hub_regions = toset(keys(var.event_hub_mapping))

  # List of all region+customer pairs
  # Example result:
  #   event_hub_for_each_mapping = {
  #     "eastus+juliette" = {
  #         customer = "juliette"
  #         region   = "eastus"
  #       }
  #     "eastus+romeo"    = {
  #         customer = "romeo"
  #         region   = "eastus"
  #       }
  #     "eastus2+romeo"   = {
  #         customer = "romeo"
  #         region   = "eastus2"
  #       }
  #   }
  event_hub_for_each_mapping = merge(values({
    for region, customers in var.event_hub_mapping : region => {
      for customer in customers : "${region}+${customer}" => {
        customer = customer
        region   = region
      }
    }
  })...)
}

# Provision an Event Hub Namespace in every region where a customer has
# provisioned Resources. Note: each.key below is the region name.
module "event_hub_namespaces" {
  for_each = local.event_hub_regions
  source   = "./event_hub_namespaces"
  location = each.key
  name     = "azure-log-ingest-${each.key}"
}

# Provision an Event Hub in each region's event hub namespace for every customer
# with Resources in that region
module "event_hubs" {
  for_each       = local.event_hub_for_each_mapping
  source         = "./event_hubs"
  customer       = each.value.customer
  namespace_name = "azure-log-ingest-${each.value.region}"
  # ... partition and Data Capture configuration

  depends_on = [module.event_hub_namespaces]
}
Continually running these background jobs gives us a self-healing configuration that automatically adapts to our customers’ environments as they change.
Objective 3: Log analysis
Our final step is performing analysis on the logs we collect. As we’ve covered in previous blog posts, our detection engine is built using a micro-batch streaming design. That means we need to export the events from each customer’s Event Hub into micro-batch files in our Azure storage account. This is super easy thanks to the Event Hub’s Data Capture feature, which handles reading the individual log events from the Event Hub, batching them together, and writing them to files in our storage account. All we need to do is ensure that each Event Hub has enough partitions configured to keep up with the data throughput for that customer. Once the micro-batch files are written to our Azure storage account, our detection engine receives a notification through Azure Queue Storage that a new file is available for processing and analysis.
One last bit of complexity
That would be the end of this blog post, except that the way Azure logs activity is…interesting. For the vast majority of log sources that we collect, each entry in the log corresponds to a single “event” that happened in the source system. This could be a process start or network connection from an EDR source. Or a user authentication or 2FA push from an identity source. In Azure’s logs, every “event” is recorded across at least two separate log entries.
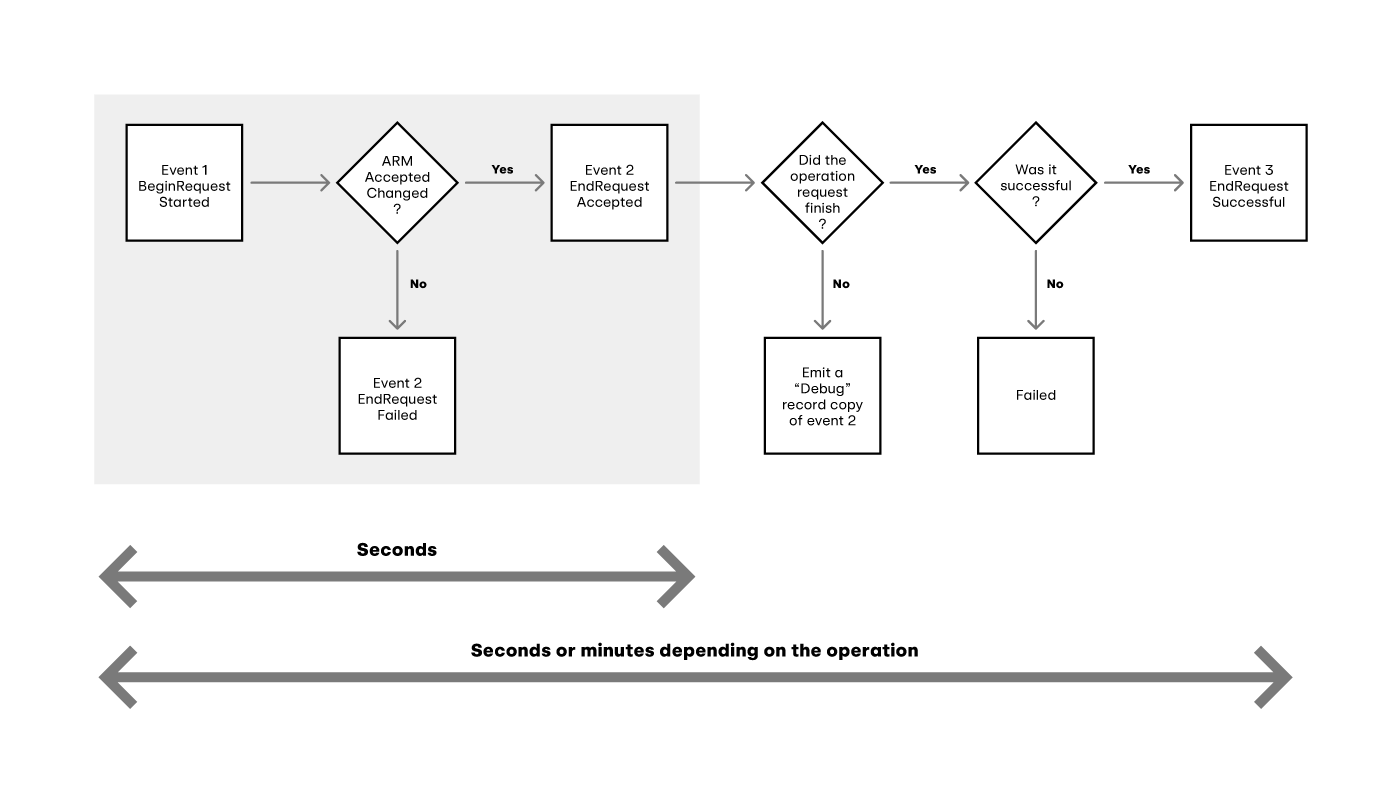
Azure’s logging flow
For any API request, Azure logs the request, the response, and any results as separate log entries. The request entry tells us what the API request was attempting to do. The response entry tells us whether or not Azure accepted and processed that request. The result entries contain additional details from the backend services about what actually happened. In order to give our customers accurate threat detections, we need to combine the information from at least the request and response entries, otherwise our security engineers will have to waste their time investigating suspicious behavior that Azure already blocked. Thankfully, each log entry has a correlationId field we can use to tie everything together.
{
  "operationName": "MICROSOFT.NETWORK/NETWORKSECURITYGROUPS/SECURITYRULES/WRITE",
  "resultType": "Start",
  "correlationId": "30674a56-6343-4da9-a63b-f0589203046f",
  "properties": {
    "requestbody": "..."
  }
}
{
  "resultType": "Accept",
  "correlationId": "30674a56-6343-4da9-a63b-f0589203046f",
  "properties": {
    "statusCode": "Created",
    "responseBody": "..."
  }
}
{
  "resultType": "Success",
  "correlationId": "30674a56-6343-4da9-a63b-f0589203046f",
  "jobId": "ProxyResourceLongOperationJob:12345",
  "properties": {}
}
This means that our Azure logs have to run through a special pre-processing step at the beginning of our processing pipeline. This step combines the separate request and response entries into a single log entry with a complete picture of what was attempted and whether it was successful.
{"operationName":"MICROSOFT.NETWORK\/NETWORKSECURITYGROUPS\/SECURITYRULES\/WRITE","resultType":"Start","correlationId":"30674a56-6343-4da9-a63b-f0589203046f","azure_activity_administrative_condensed":{"num_correlated_records":3,"statuses":{"start":{"resultSignature":"Started.","properties":{"requestbody":"..."}},"accept":{"resultSignature":"Accepted.Created","properties":{"statusCode":"Created","responseBody":"..."}},"success":{"resultSignature":"Succeeded.","properties":[]}}}}With this completed, the rest of our processing pipeline is able to handle our Azure logs the same way it handles all of our other telemetry sources.
Related Articles
The dual-use dilemma: Rethinking detection for remote access tool abuse