Everyone in the industry is talking about how to secure the cloud. But what exactly are we securing the cloud against? When Red Canary talks about “threats in your cloud environment,” we’re talking specifically about threats that manifest within the cloud control plane itself, such as unauthorized Kubernetes pod access, credential use from unauthorized locations, API abuse, data exfiltration, and more.
I recently presented on how Red Canary detects cloud threats in our customers’ environments at both CloudNativeSecurityCon and the SANS CloudSecNext Summit & Training, and I’d like to walk through our detection process in a two-part blog series. This is not to say this is necessarily the “right” way to find these threats, or even the only way to find them; it’s just the battle-hardened techniques that we have been using for years to chase down this kind of activity and find the needle buried in the haystack of petabytes of data.
What is the cloud control plane?
Before we get ahead of ourselves, let’s talk through what we mean when we say “cloud control plane.”
Every cloud provider uses a different vocabulary, so let’s establish the terminology we’re going to use throughout this article.
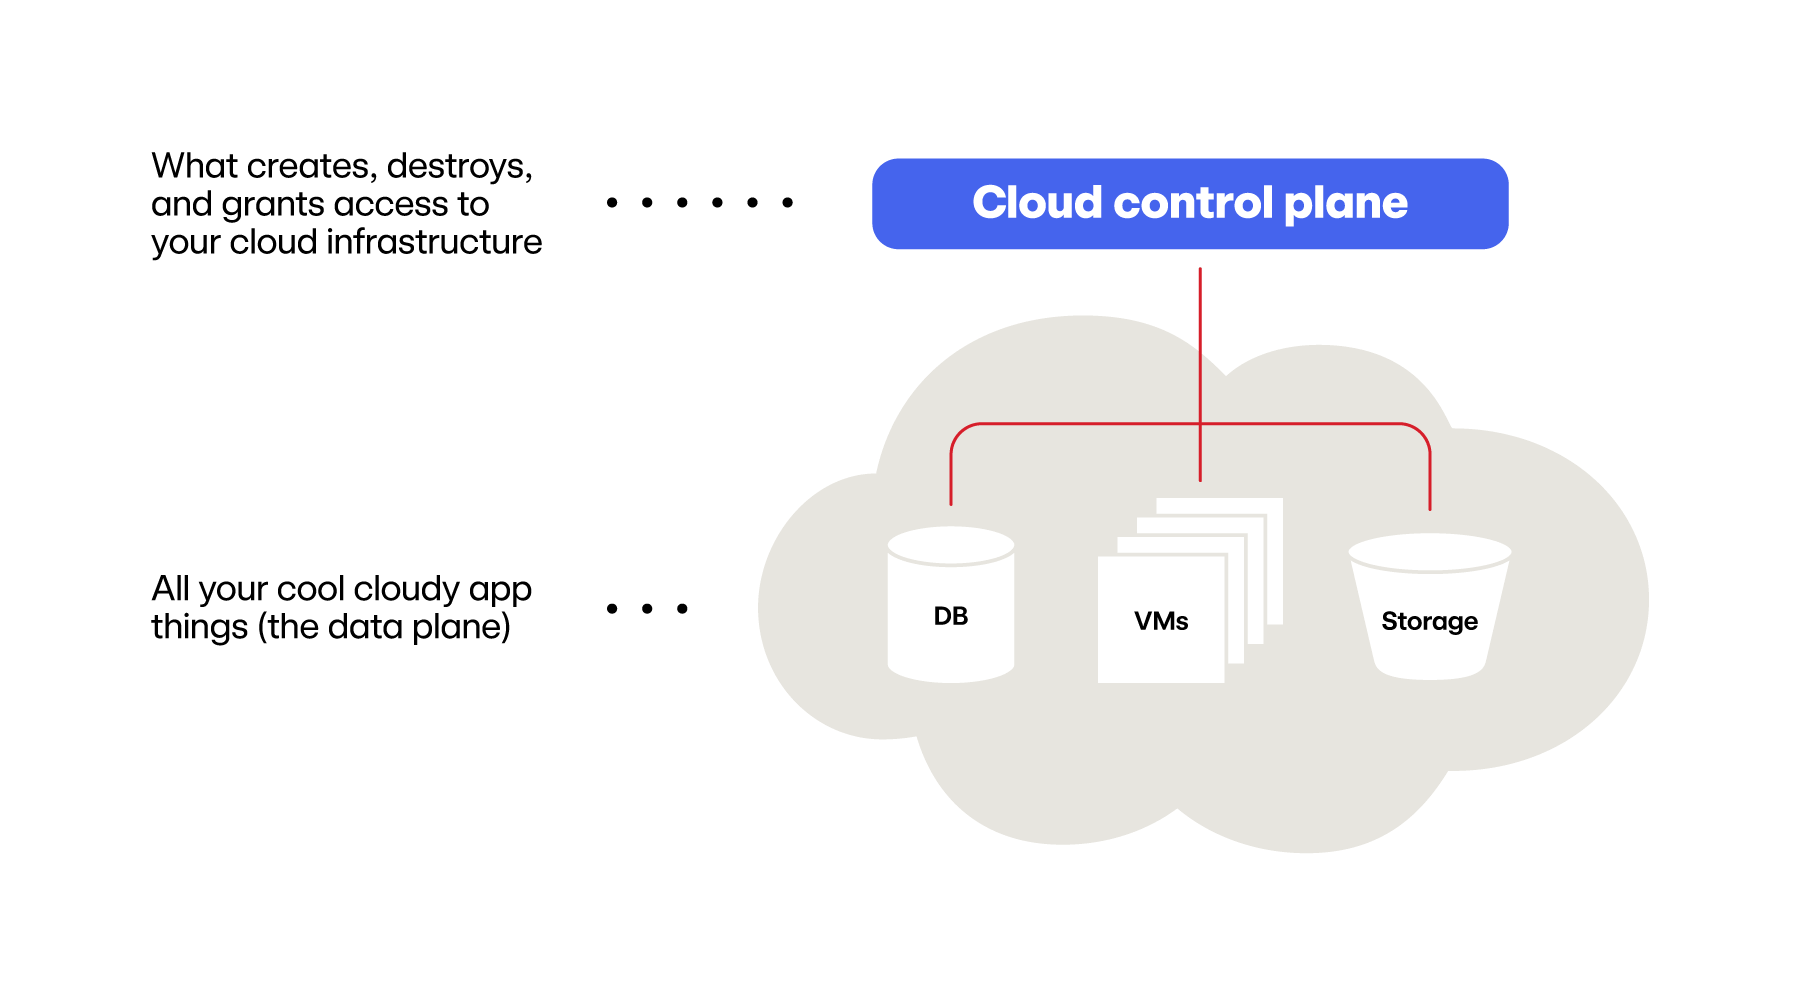
First, let’s start with the “stuff” you have deployed in your cloud. Maybe that’s some virtual machines, a few databases, storage buckets, serverless functions, and probably a handful of other cats and dogs (that hopefully you know about). All of these resources that are deployed within the cloud reside in what we’re calling the cloud data plane. We’re not going to focus on what’s inside this data plane in this article; in some cases (such as virtual machines), there are other technologies like endpoint detection and response (EDR) that directly apply to protecting these resources.
Instead, we’re going to focus on the cloud control plane: this is the layer on top of all of your cloud resources that keeps track of all of the things in your data plane and allows users to create, destroy, or configure these resources within the data plane. This might be the cloud web user interface (UI), command-line interface (CLI), or application program interface (API) access.
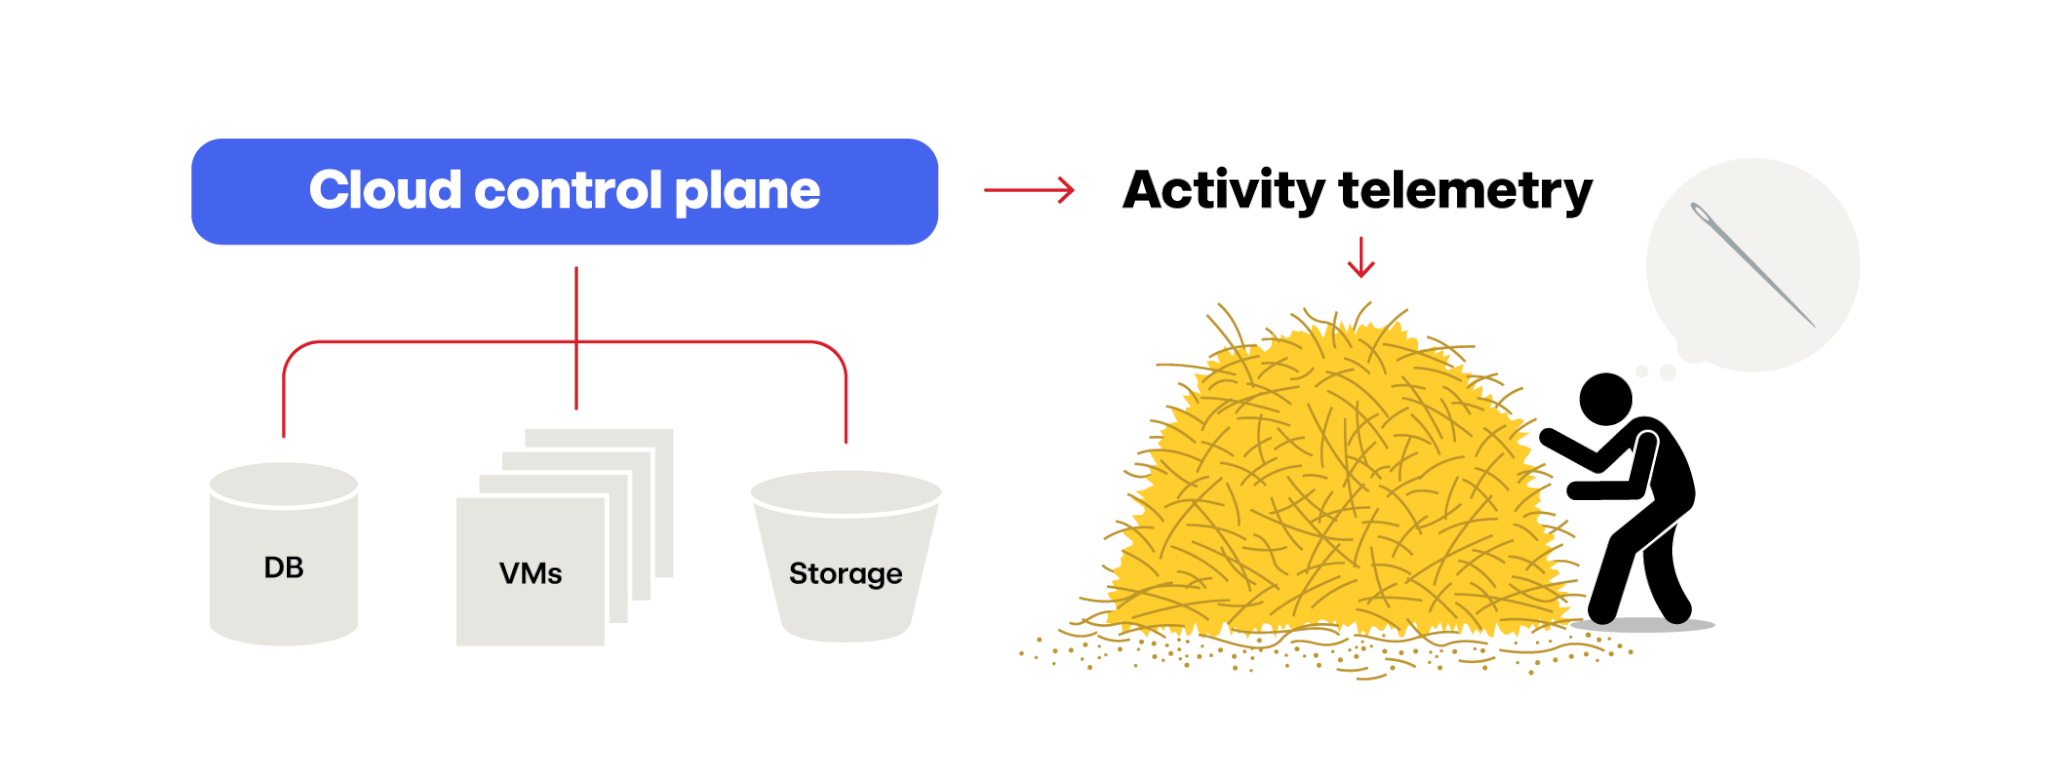
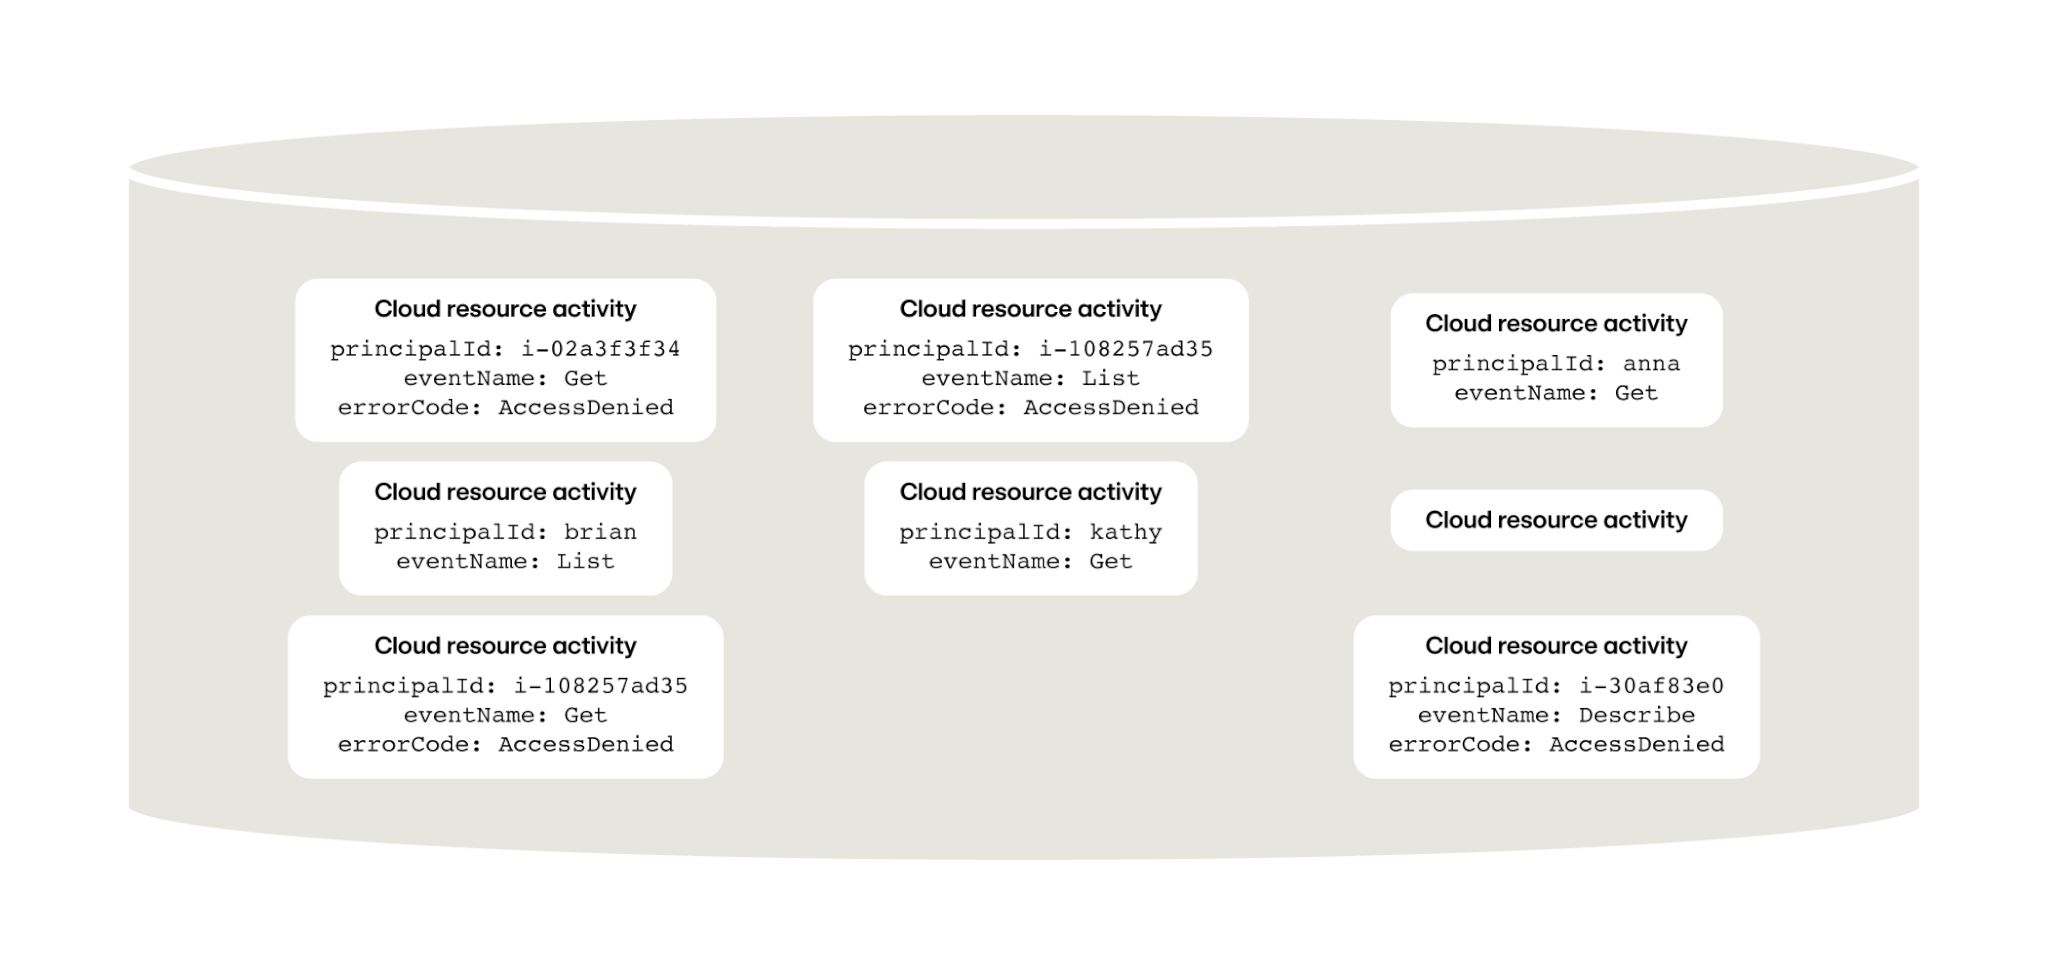
Every cloud provider’s cloud control plane is outputting a pile of audit logs, such as AWS CloudTrail, Azure Monitor Logs, GCP Audit Logs—logs that we’ll refer to as telemetry throughout this article. This telemetry captures the creation of every resource, every resource that’s been stopped, every change to a security group or firewall, every API call made to access a serverless resource, and hundreds (if not thousands) of additional records tracking everything that’s happening to your cloud resources, as visualized in this hyper-accurate illustration:
If you’re not interested in cloud, but you’d rather look at Kubernetes logs, the same concept exists: the Kubernetes control plane outputs the same type of telemetry with the creation and termination of pods, access to pod resources, etc. The following approach applies just as well to Kubernetes telemetry as it does to cloud telemetry.
At the end of the day, all of this telemetry creates a massive pile of data. How do you wade through that pile to find a single threat? As of this writing, Red Canary ingests about 6 billion cloud telemetry records per day—if we can do it, so can you!
The six phases of cloud threat detection
To tackle any problem, it’s best to break it down into smaller pieces. These smaller pieces make the problem much easier for a human to wrap their head around, and, ultimately, enables solutions that are simpler to manage.
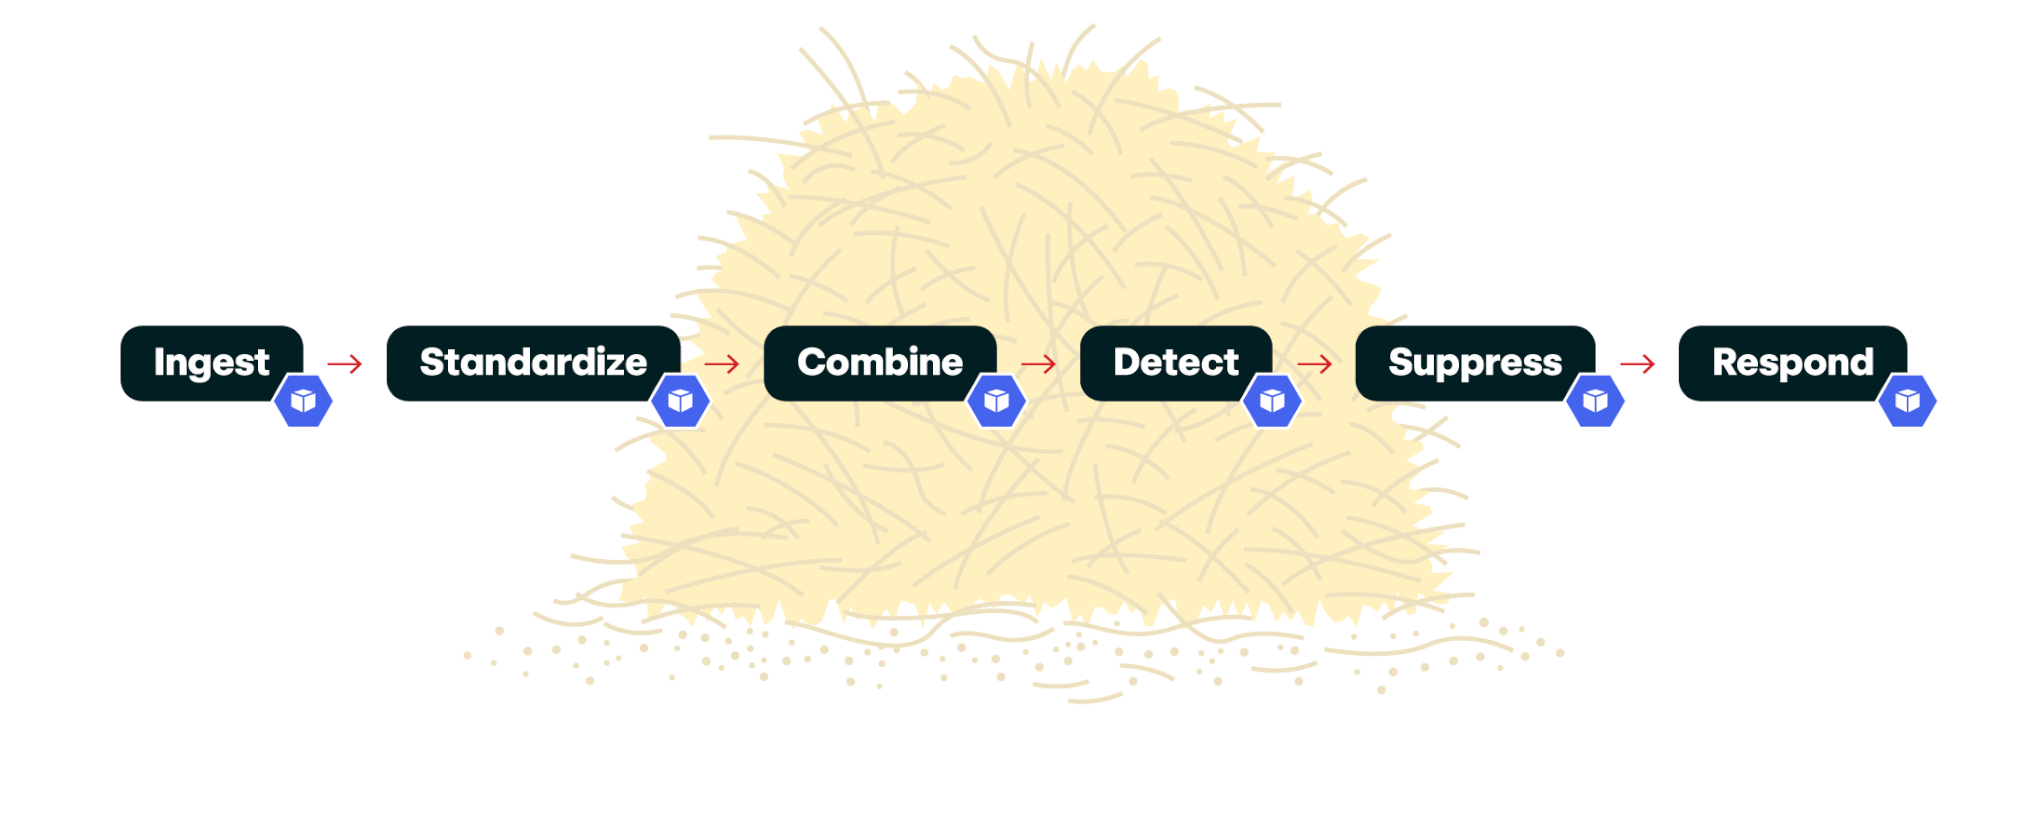
We’ve broken this problem down into six distinct phases. We’ll dive into each in detail below:
- Ingest
- Standardize
- Combine
- Detect
- Suppress
- Respond
From a technical implementation standpoint, we take these individual phases and develop individual software components to handle each one. This approach follows a general Unix philosophy, as quoted by Doug McIlroy, the inventor of Unix pipes:
- Write programs that do one thing and do it well
- Write programs that work together
- Write programs to handle text streams, because that is a universal interface
For each of these conceptual blocks of work, we create small and simple (but highly scalable) components that can be chained together to sort through the haystack. Each of these components is also an independent Kubernetes deployment (more on that topic a little later on).
Phase one: Ingest
The first phase to talk about here is getting data into your processing system: Ingest.
Since we’re just starting to think about these phases, it’s easy to overcomplicate things here. Don’t. Remember the guiding Unix principles listed above.
Ingest’s job is simply to move the data to where you want it to go next. That’s it.
Now, there’s already some complexity embedded in that task. Depending on where the data (telemetry) is, moving it out of one cloud environment may be tricky and may even have cost implications. Also, remember to focus on “the data you want”; this is a good place to filter out any extraneous data that doesn’t provide much value to you (because the farther you push this data into your system, the more it will cost you to process it. Turning it away at the front gates is usually the most cost-effective option).
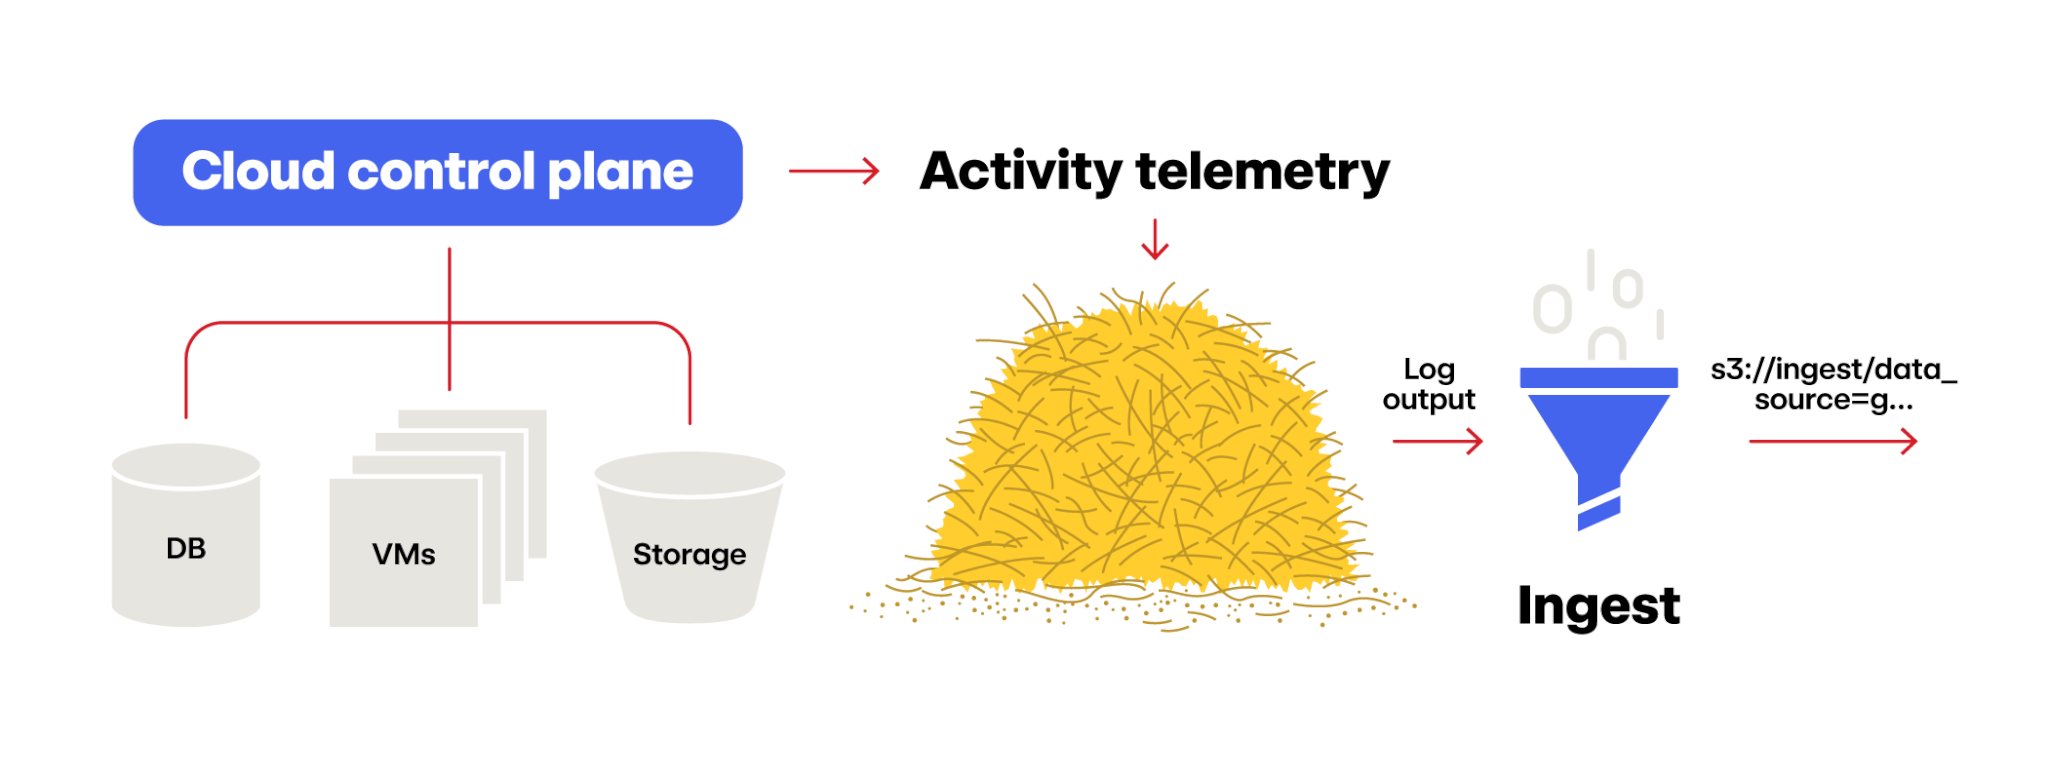
First, you have to get the data:
For us, an ingestor is typically just a file copier that grabs a file from the source, like an S3 bucket with a CloudTrail log file in it, and copies it to a place that we want it, like our ingest S3 bucket. If we have to, we’ll actually open up the file to discard telemetry records we’re not interested in, and our output file will have a filename with key metadata that follows a common internal convention (which makes moving the file around easier if no one has to actually open it to get basic metadata about the file).
Red Canary has shared insights about some of these data transfer challenges in the past, and you can read this fantastic article by my colleague James Mason on the subject.
Before we move on to the next phase, let’s revisit the concept of filtering out data. It’s tempting to say “all of this data is absolutely critical for me to detect threats in my environment.” I guarantee that’s not true. Cloud telemetry can be extremely voluminous and repetitive. Attempting to process all of it gets extremely expensive very quickly for certain telemetry-heavy operations.
Cloud telemetry can be extremely voluminous and repetitive.
As an example, when you query a large data lake (which is usually a collection of files sitting in cloud object storage like Azure Blob Storage), the cloud control plane captures log records of every file that the query engine (such as Amazon Athena) touches—which could be millions of files depending on the size and configuration of your data lake. If there are lots of data lake queries, each query will generate this volume of logs—none of which are pointing to a potential threat. Identifying these high-noise data sources is critical to keeping processing costs under control.
Phase 2: Standardize
Once the data is in your system, the next step is to normalize the data into a common format, a term we’ll call standardizing.
But why? If you’re only ingesting data from one data source, can’t you just use their native format and call it a day? The answer is, “yes, you absolutely can,” however it won’t be long before you (or, more likely, your boss) wants to add another source of data.
Let’s say, for example, that you start by ingesting AWS CloudTrail telemetry. But then your boss wants to start looking at your Azure Monitor Log telemetry as well. Or perhaps you’d like to combine in your organization’s Okta logs. These are all things that inevitably come as your capability to detect threats matures—but the catch is that if you don’t start with a standardized format, you’ll encounter a massive headache downstream every time you add a new data source (as opposed to a minor headache in one place, during the standardization phase).
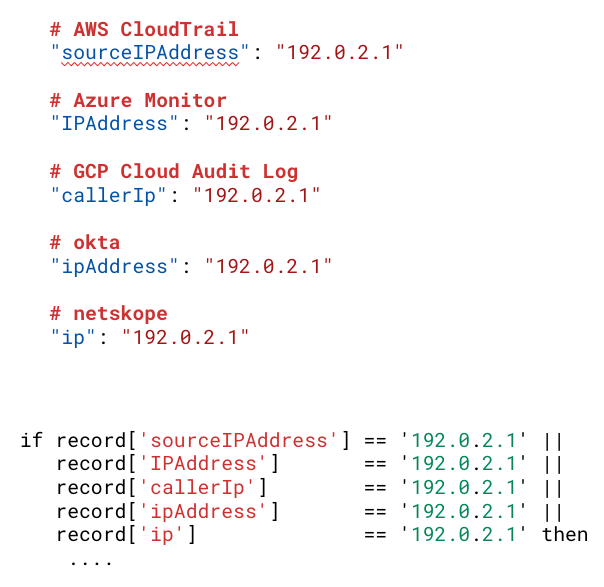
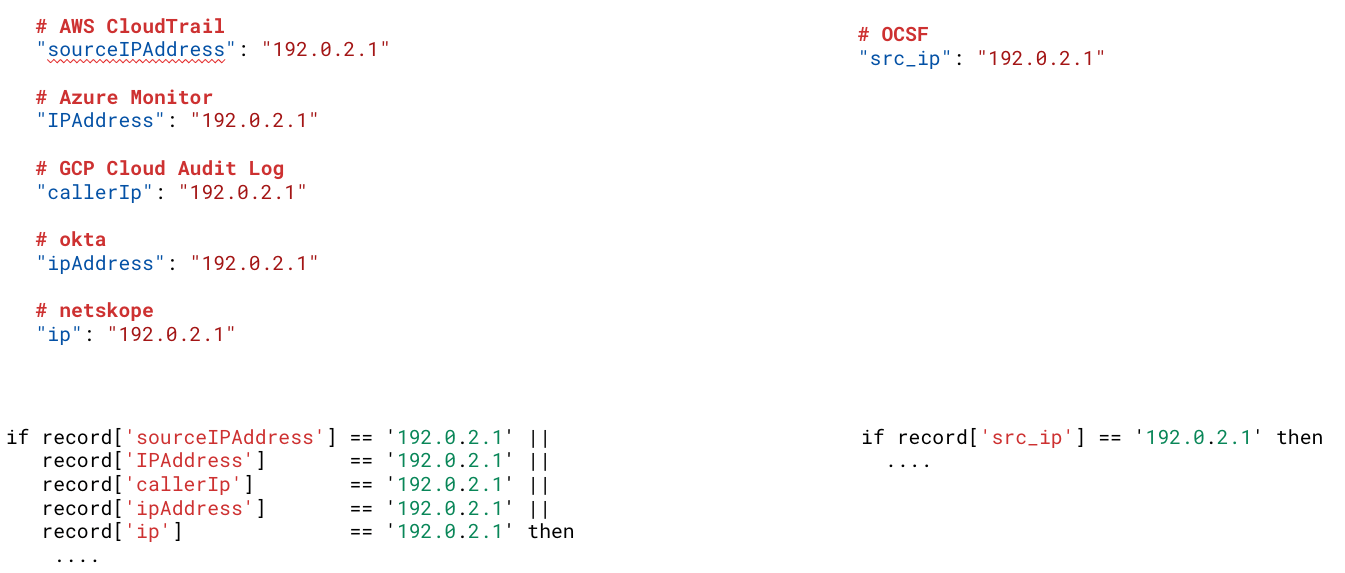
As an example, let’s look at a common and critical field you’d expect in telemetry: IP address.
- In the AWS CloudTrail telemetry format, this field is called
sourceIPAddress - In Azure Monitor telemetry, it’s called
IPAddress - GCP Cloud Audit Logs call it
callerIp - Okta calls it
ipAddress - In Kubernetes Audit Logs, it’s called
sourceIPs
And that’s just one field! When you start to include other fields (time stamps, location, event, etc.) the complexity skyrockets.
If you carry this logic downstream (we haven’t really talked about this part yet) and think about how you’d detect bad behavior based on a known malicious IP address, you’d end up having to write a detection rule for IP addresses resembling something like:
As an added downside, this trivial detector logic (and any others that included the IP address field) would need to be updated every time a new telemetry format was added to your pipeline.
So what should you standardize to?
Everyone wants to build a new standard (xkcd.com/927)
Red Canary has an internal format that we call the “standardized activity model.” You too can develop your own standard but it always makes sense to survey the landscape and see if an established standard will meet your needs more easily. A current example is the Open Cybersecurity Schema Framework (OCSF), which seems to be gaining some momentum, and it’s just as good as any at this point.
So, for the sake of example, let’s say you pick OCSF, then the IP address field simply becomes: src_ip. But—and here’s the real power—the detector logic we talked about before becomes: if record[‘src_ip’] = 192.0.2.1
This vastly simplifies all of the downstream logic as there is only a single value to keep track of, not a different value for each telemetry-stream type.
Phase 3: Combine
After standardizing the data, the next phase in the processing pipeline is “Combine.”
So far, we have disparate pieces of information flowing in, likely in an asynchronous fashion and not grouped with other related pieces of data; it’s just raw events streaming through the Ingest and Standardize steps. Every part of the pipeline so far has been completely stateless (which is the key to scalability): the component simply works on the piece of data that’s presented to it and moves on.
Unfortunately, detecting malicious behavior isn’t about finding a single event; it’s about detecting a behavior trend over time that’s an indication of malicious activity. As a simple example, half the time I attempt to access the AWS CLI, I forget to auth and receive an auth error returned by the software development kit (that would absolutely generate an audit log entry). Or my web console session times out and so my command is rejected. Or I connect to the wrong Kubernetes cluster to act on a specific resource. All of these behaviors are completely normal and not an indication of malicious activity. But continuously repeated errors of this nature may indicate that someone bad is trying to access resources. So, in order to detect this trend over time, we have to introduce “state” somewhere in our processing pipeline —that’s what the Combine phase is about.
Detecting malicious behavior isn’t about finding a single event; it’s about detecting a behavior trend over time that’s an indication of malicious activity.
This phase collects telemetry records and indexes them based on common correlation attributes. For endpoint telemetry, this would be a host process. For cloud, it’s likely a cloud principal ID (a principal represents an identity that can access a resource), or a cloud resource. The goal here is to integrate the telemetry over time to build context around a set of events to spot potentially malicious behavior that isn’t visible via a single event. You’re effectively creating a “state” around these correlation points over time—a state that will be used to detect behaviors.
To implement this, you can use any sort of off-the-shelf data store. You can use an in-memory database like Valkey, a relational database like Postgres, or a noSQL data store such as OpenSearch—whatever you choose, however, is going to be very aggressively written to by the Combine component AND aggressively queried from the subsequent Detect component, so choose wisely.
Like in many other phases, it’s tempting to say “well, if I’m writing data to this database so I should run my detections here as well.” But it’s important to remember that guiding principle: do one thing and do it well. Fight the urge. Just write the data to the data store here. We’ll get to querying it in the next phase.
Phase 4: Detect
Once we’ve combined the data around a consolidated “state” key, the next phase in our processing pipeline is where the magic happens. It’s time to apply our analytics to look for the behavior we want (or, more accurately, behavior we DON’T want).
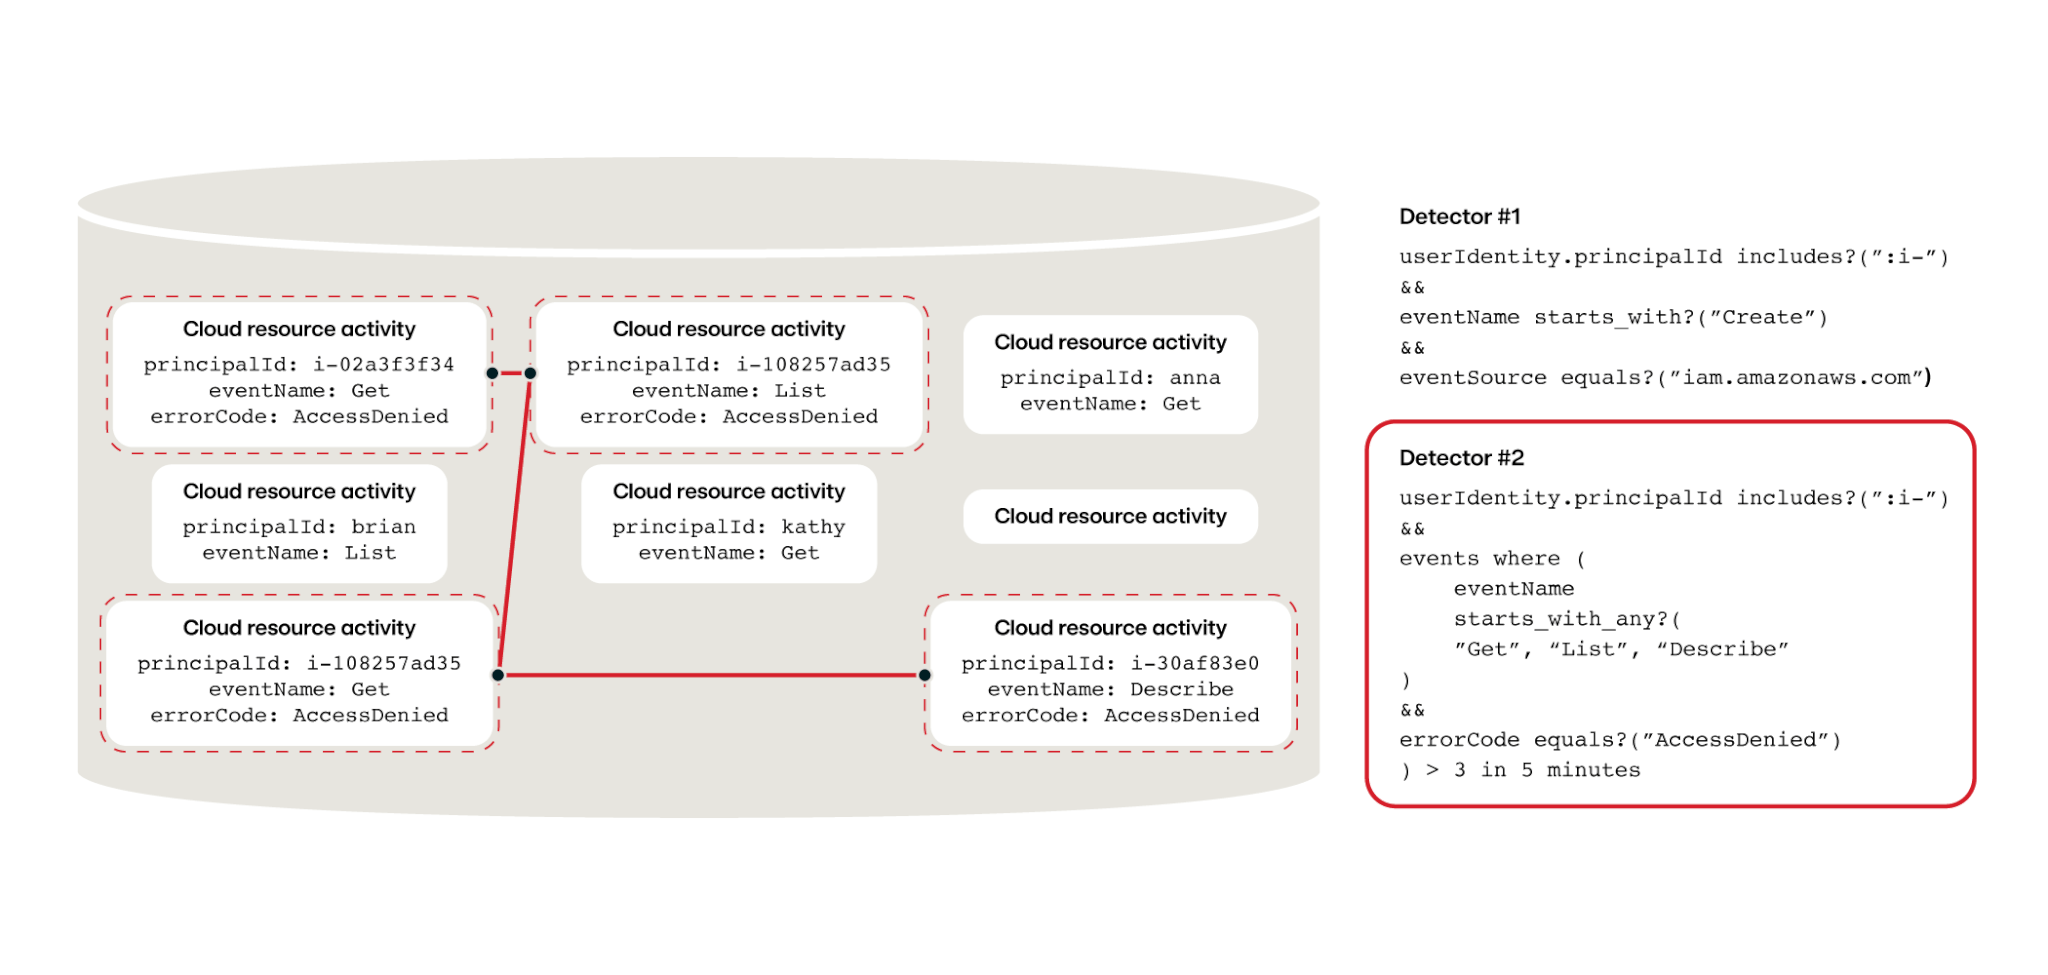
This is part of the processing pipeline where we apply our predefined analytics, or detectors, against the combined states. With every new piece of “information” that gets stored in the Combine phase, the Detect phase can check the data store and say “okay, how about NOW?” with its set of detectors, running through the complete set of applicable detectors every time a change in “state” is observed.
What do these detectors look like? Here’s an example of behavior demonstrating API cloud abuse:
Detector #1:
userIdentity.principalId includes?(“:i-”)
&&
eventName starts_with?("Create”)
&&
eventSource equals?(“iam.amazonaws.com”)
Detector #2:
userIdentity.principalId includes?(“:i-”) &&
events where (
 eventName
 starts_with_any?(
 "Get", "List", "Describe"
 )
 &&
 errorCode equals?("AccessDenied")
) > 3 in 5 minutes
Detector 2 requires this behavior to occur at least three times in 5 minutes for it to evaluate to true, underscoring the importance of the Combine phase.
Once a detector matches, this component can bundle up all of the detection information, including the combined state from the state store, and emit it as a single “detection package” or detection downstream to the next phase in the pipeline.
Who creates this detection logic?
Stepping aside from the processing pipeline for a moment, let’s talk about the behaviors that we’re looking for inside the telemetry: the detectors themselves.
One of the key advantages of this processing pipeline architecture is that you can have a team that’s focused on building and maintaining the processing pipeline and another independent team that’s focused on defining behaviors to look for. Internally, this is how we operate at Red Canary, with our Engineering team working on building the processing pipeline, and our Detection Engineering team defining and refining our detectors to look for threats. This is extremely powerful, as these two groups of talented engineers frequently have very different, non-overlapping skillsets. Our software engineers are good at writing Ruby and Go, and our detection engineers are amazing at thinking like an adversary and determining what behaviors we want to look for. Both roles require complex engineering skills, but in very different problem domains.
Detectors often leverage community content, such as indications of compromise and behavioral analytics published by vendors and independent researchers.
Phase 5: Suppress
Let’s move on to the penultimate phase in our pipeline here: Suppress.
Every time you find something in the Detect phase, it gets emitted, along with all of its details, downstream to the Suppress phase.
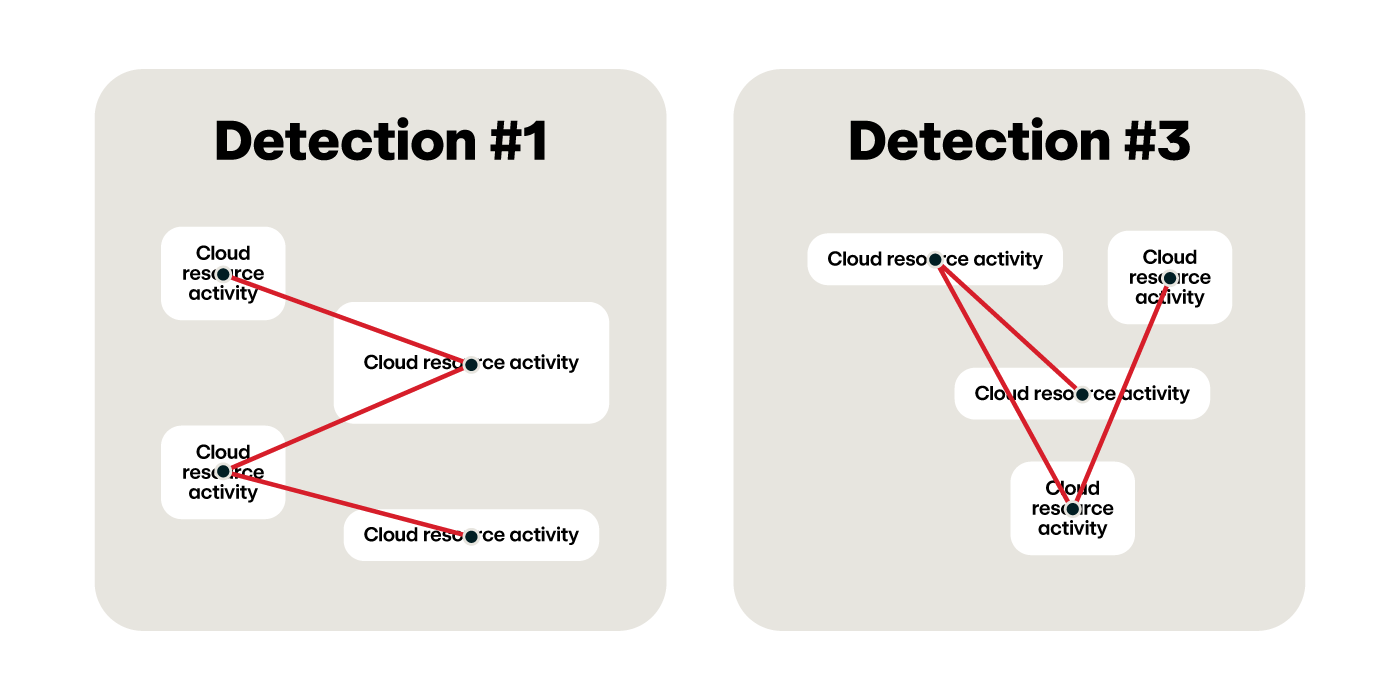
In the figure above, you can see that we’ve found five different detections. For every detection we receive, we need to investigate them to determine if they’re a real threat or a false alarm. Suppression allows you to “save” this investigation and avoid repeating it in the future.
For example, let’s say that Tim often forgets his password repeatedly and locks himself out of the Cloud UI Console. Or Sally, a site reliability engineer (SRE), is constantly opening shell access into Kubernetes pods. Neither of these behaviors are malicious, but your detectors may still trigger—and you want them to! You want your detectors to be very sensitive so you don’t miss malicious behavior. But you need a way to incorporate the resulting investigations so the alerts don’t keep getting generated. Once a detection engineer has determined that it was just Tim or Sally and deemed this behavior as “not a threat,” they can create a suppression rule that says “suppress these detections when it comes from Tim or Sally” or “suppress these detections when they come from our SRE team.”
This ability to “store” investigations and eliminate future duplicate investigations for the same set of conditions is a tremendous force multiplier for your team.
The next time Tim forgets his password, the pipeline will detect this potentially malicious behavior and, at the Suppression phase, this detection will be suppressed and not sent to a human (reducing alert fatigue and lowering the burden on a human to review non-threatening behavior).
Separating the suppression logic from the detector logic provides more “knobs” that your detection engineers can tune to reduce false positives and increase the signal above the noise within the processing pipeline.
Phase 6: Respond
You’ve now made it to the final phase: Respond. You’ve got two detectors that have fired and made it past the Suppress phase, and now you can act.
It’s important to note that this processing pipeline and the detection logic should be focused on things that are interesting and require investigation. It should not convict things based solely on the data. Over time, you may gain enough confidence in certain detections that they require little or no additional human investigation, but at this stage, detections need to be investigated by someone to determine if they’re real threats or false alarms (that need to be suppressed).
Your detection processing pipeline should not convict things based solely on the data.
How you facilitate this investigation is largely up to you: you can automatically fetch additional context and state from the data store in the Combine phase, you can manually dig into the data sources generating telemetry to see what context they can provide, or you can simply execute a set of automated scripts or notifications based on what your organization needs.
The shrinking haystack
So let’s walk through this. At each step along the way, we’re reducing the size of that haystack down:
- We’re filtering out data
- We’re discarding what we don’t need
- We’re writing detection logic that looks for the behaviors we want
- We’re discarding known false positives
- Then we’re ready to investigate on the “needles” in that haystack
Now that you have an understanding for the logical breakdown of processing phases, the next challenge is to build it. Find out how in part 2 of our Shrinking the haystack series: “Building a cloud threat detection engine.”
