

Industry and sector analysis
Our analysis of technique and threat prevalence and detection volume across sectors suggests that an organization’s industry is not a key factor in determining the level or nature of risk they face.
Editor’s note: While the analysis on this page is still relevant, it has not been updated since 2024.
Is an organization’s industry an important factor in determining the types of threats they face, the techniques that adversaries use against them, or the general level of risk they’re exposed to? We looked at our detection data set to answer this question and shed light on the relative risks—or the different kinds of risk—faced by organizations in different industries. After analyzing our detection data against many different variables, we decided to focus on the following metrics:
- Detection volume
- Threat prevalence
- Technique prevalence
The importance (or not) of industry as a differentiator
A core tenet of threat intelligence is the idea that different threats affect different organizations. For example, if you are a small retail business in the U.S., you would generally deprioritize threat reporting about Russian adversaries targeting Ukrainian government organizations. As organizations seek to understand the threats that are most likely to affect them, they naturally might look to industry as an easy way to help them identify the most important threats to focus on.
However, from Red Canary’s perspective, which we’ll outline using the data below, an organization’s industry alone is rarely the key factor in differentiating the threats they face. Instead, we’ve observed that the technologies an organization uses, the way their network is configured, their IT hygiene, the data they have, and how they store it are more important factors in determining their exposure to risks than is their industry. Put another way, the factors that make companies alike have more of an impact on the threats they face than the factors that set them apart.
Additionally, the majority of threats we detect are opportunistic—adversaries are looking for whatever victim they can compromise, perhaps those that have a certain unpatched vulnerability or one from whom they know they can elicit a ransom payment. Some adversaries target specific types of organizations—or even specific industries—but these represent a minority of incidents we observe. Even when adversaries focus on a specific industry, they seem to abuse the same common techniques.
In short, we recommend organizations prioritize the threats that are most likely to affect them. Industry is one variable to consider, but your main focus should be on the cross-section of threats that are highly prevalent based on the technologies your organization uses, the data it contains, and the ways it handles that data. Examining what makes your organization a likely target across a wide range of variables will allow you to have a better understanding of your threat model and the risk presented by various threats.
So, what does the detection data tell us about industries?
The following sections showcase the highlights of our analysis of detection data across industries. Security practitioners can use this information as a benchmark to understand where they stand relative to their peers.
Note: Our analysis in this report is based primarily on the North American Industry Classification System (NAICS) two-digit, sector-level categories. This is their least specific classification, and we’ll note when we’re discussing their more specific three-to-six-digit categories. We made this choice to align with other infosec reporting, such as the Verizon Data Breach Investigation Report.
Adjusting imbalances
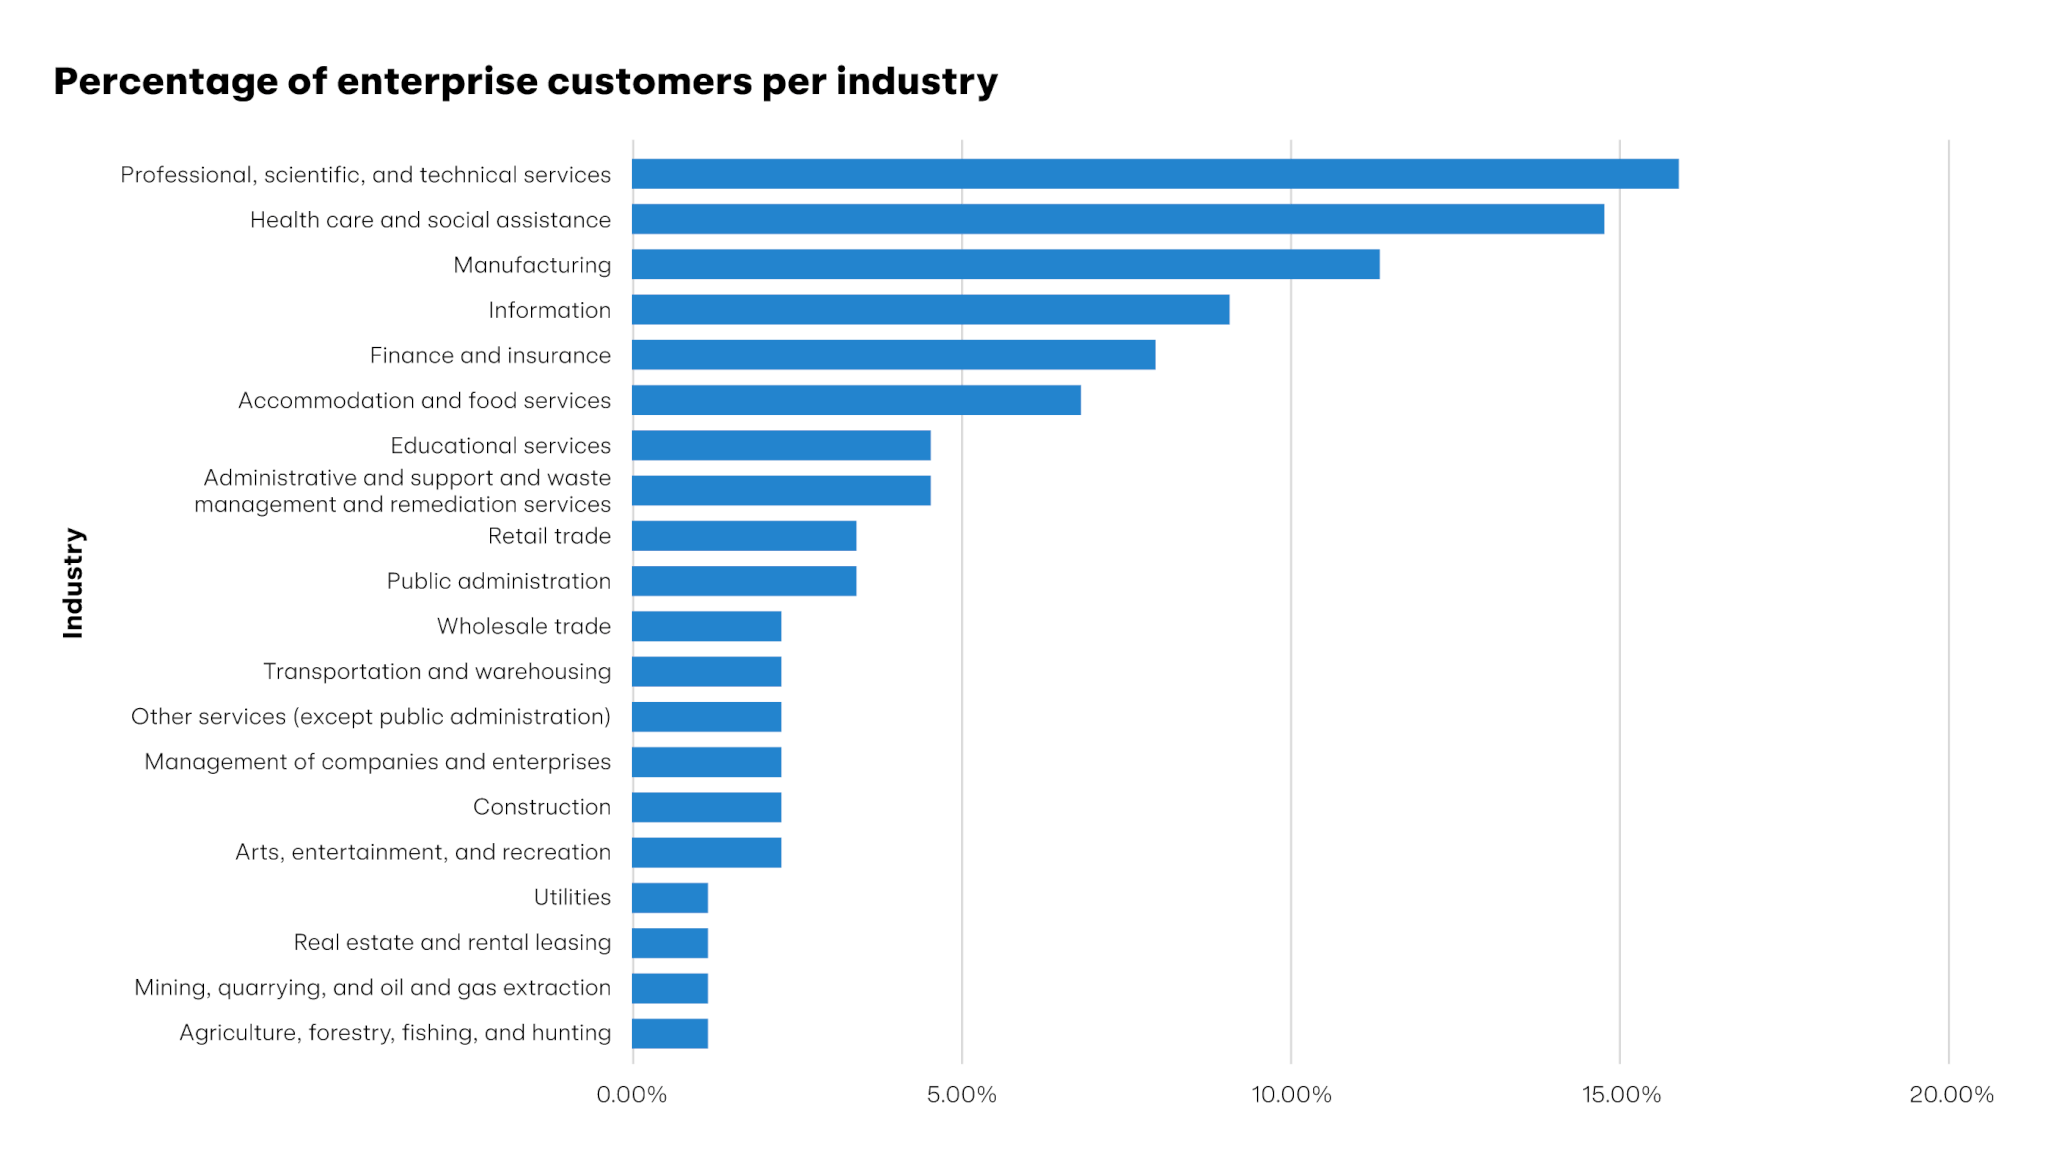
As you can imagine, we have an unequal representation of customers across industries. Industries with greater numbers of customers (or with higher than average numbers of large customers) generate greater volumes of detection than industries with fewer customers. Since this may create the illusion of higher risk, we adjusted some metrics by dividing detection volume by the number of customers within a given sector to establish a “per capita” view of the figures. Thus, detection counts below will be represented as detections per customer. We’ve also included information about the relative number of small (1-1,000 employees), mid-sized (1,001-4,000), and large enterprise (4,001+) customers within an industry where relevant.
Detection volume by industry
The following graph shows the number of detections per customer across the industries we tracked in 2023.
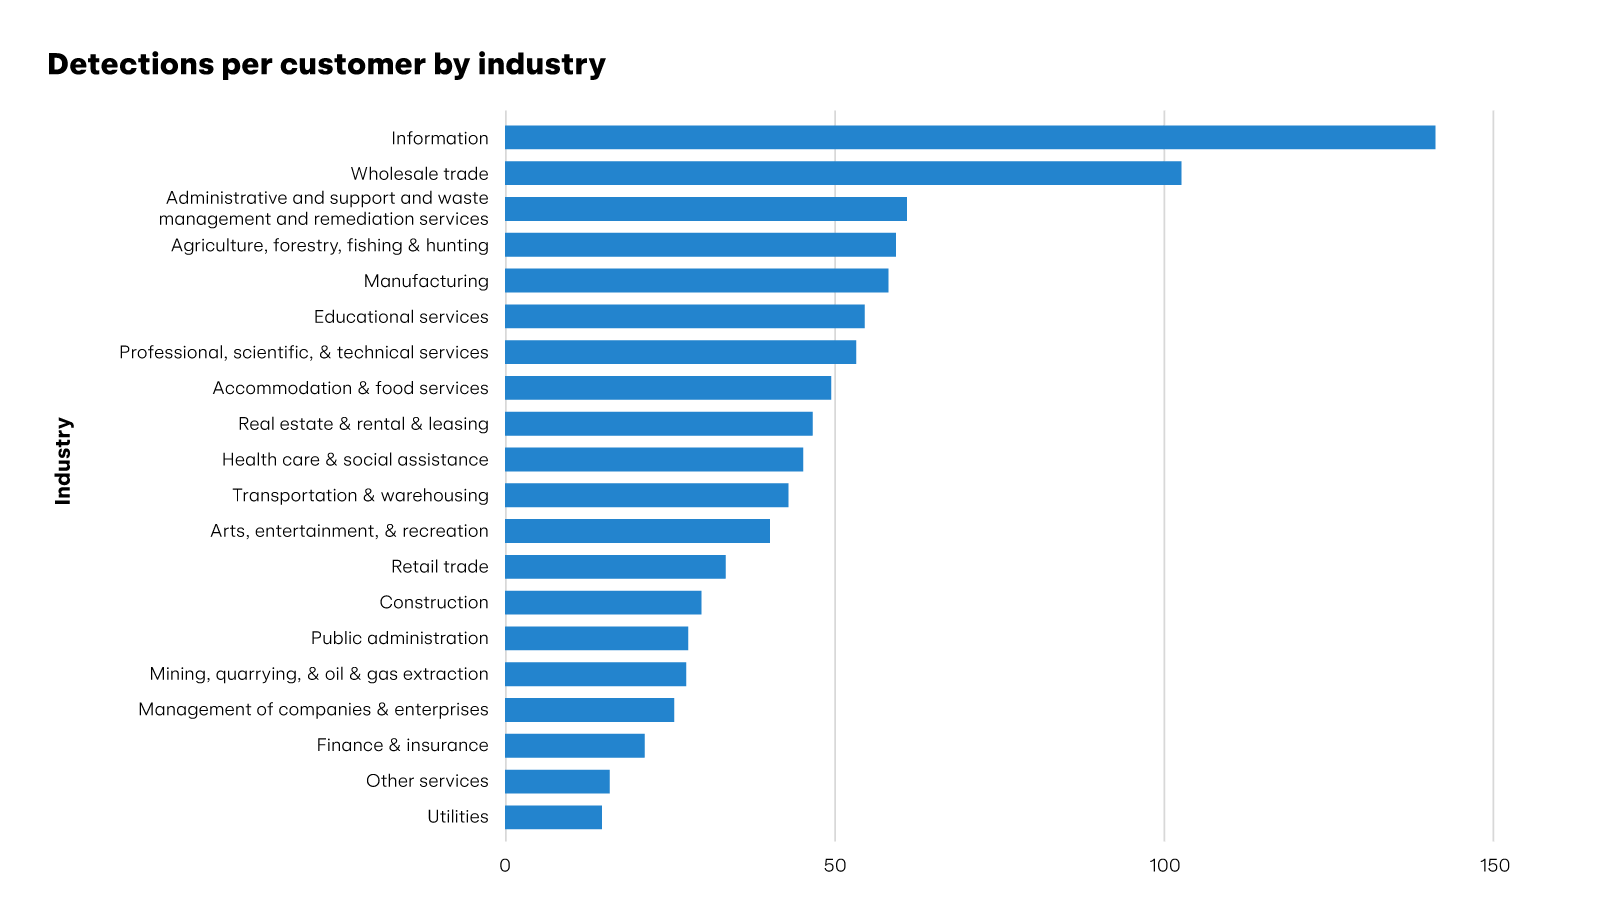
As you can see, customers in the information and wholesale trade sectors generated far higher volumes of detection on average than customers in any other sector. The information sector in particular likely tops this list because of its relative density of large enterprise customers (see next chart). Wholesale trade, on the other hand, has a relatively low density of similarly-sized enterprise customers. While this anomaly is interesting, it’s hard to pin down exactly why wholesale trade companies are generating higher volumes of detection without burrowing deeper into the data.
While wholesale trade is the only conspicuous outlier with a high detection-per-customer count, the finance and insurance sector is an equally conspicuous outlier for the opposite reason. Many of our customers in the finance and insurance sector are quite large too, and yet it was among the three lowest in per-customer detections. This is probably because finance and insurance companies operate in the face of strict data compliance standards and invest relatively large amounts of money and resources into their security architecture—both to comply with regulatory restrictions and to prevent the erosion of trust. Given this, they may have a wider net of security controls that are stopping more threats before they slip through the preventive layer and need to be detected by a company like Red Canary.
ATT&CK techniques by industry
One key takeaway from our analysis of technique abuse across industries is that adversaries reliably leverage the same small set of 10-20 techniques against organizations, regardless of their sector or industry. The first column in the following table shows the overall top 10 techniques ranked by total detection volume across all Red Canary detections in 2023. The second looks at the top 10 techniques for each specific industry and counts the number of times a technique shows up in any individual industry’s list of top 10 techniques. For example, T1059.003: Windows Command Shell is a top 10 technique in all of the 20 industries we tracked, T1059.001: PowerShell is in the top 10 for 19 industries, etc. The purpose of this comparison is to measure the generality of technique abuse and prevalence across industries.
| Top techniques by detection volume | Top techniques by industry |
| T1059.001: PowerShell | T1059.003: Windows Command Shell (20) |
| T1059.003: Windows Command Shell | T1059.001: PowerShell (19) |
| T1047: Windows Management Instrumentation | T1047: Windows Management Instrumentation (14) |
| T1078.004: Cloud Accounts | T1078.004: Cloud Accounts (13) |
| T1027: Obfuscated Files or Information | T1105: Ingress Tool Transfer (11) |
| T1114.003: Email Forwarding Rule | T1027: Obfuscated Files or Information (11) |
| T1003: OS Credential Dumping | T1546.008: Accessibility Features (9) |
| T1218.011: Rundll32 | T1036.003: Rename System Utilities (9) |
| T1105: Ingress Tool Transfer | T1218.011: Rundll32 (8) |
| T1036.003: Rename System Utilities | T1114.003: Email Forwarding Rule (8) |
As you can see, the contents of both lists are almost identical, with only one technique in each list that isn’t in the other. T1003: OS Credential Dumping is in our top 10 by volume but not frequency; it’s ranked 11 by frequency. T1546.008: Accessibility Features is in our top 10 for frequency but not volume; it’s ranked 11 by volume. In general, the order of the top techniques changes from one industry to the next, but the set of techniques is similar. This suggests a level of universality among the most prevalent techniques abused by adversaries that isn’t meaningfully affected by an organization’s sector, meaning defenders can prioritize developing security controls for the same manageable set of techniques and gain a measurable advantage against adversaries regardless of their sector.
We’ve explained why a lot of these techniques are prevalent in this and the five previous Threat Detection Reports, but the reasons they might affect a wide swath of industries include the following:
- PowerShell and Windows Command Shell are ubiquitous across Windows systems. PowerShell is an extremely dynamic and powerful administration tool that offers adversaries a wide range of attractive functionalities for executing code, moving laterally, evading defensive controls, and more. While Windows Command Shell is less dynamic, it can still call on nearly any executable on a Windows system, execute scripts, and perform a wide range of malicious actions.
- Cloud Accounts is a new entrant in our overall top 10 techniques, and its incursion across industries is a direct result of cloud migration, the adversary interest that followed, and the subsequent necessity for organizations to develop compensatory cloud security controls.
- Like PowerShell, Windows Management Instrumentation (WMI) is a ubiquitous and well-featured administration tool that satisfies a lot of common adversary use cases.
- Ingress Tool Transfer’s prevalence is largely due to the need adversaries have to introduce external tooling into the environments they compromise.
Taking this analysis one step further, we applied the Jaccard Similarity Index, which measures similarities between two sets of data, to compare each sector’s top 10 techniques to the overall top 10 techniques from our dataset. The index applies a score of between 0 (not at all similar) and 1 (completely similar) to the two data sets.
| Sector | Similarity score |
| Real Estate and Rental and Leasing | 0.69 |
| Retail Trade | 0.67 |
| Transportation and Warehousing | 0.62 |
| Professional, Scientific, and Technical Services | 0.54 |
| Administrative and Support and Waste Management and Remediation Services | 0.54 |
| Educational Services | 0.53 |
| Mining, Quarrying, and Oil and Gas Extraction | 0.44 |
| Information | 0.43 |
| Health Care and Social Assistance | 0.38 |
| Management of Companies and Enterprises | 0.38 |
| Utilities | 0.37 |
| Manufacturing | 0.33 |
| Construction | 0.33 |
| Wholesale Trade | 0.31 |
| Other Services (Except Public Administration) | 0.31 |
| Finance and Insurance | 0.25 |
| Arts, Entertainment, and Recreation | 0.22 |
| Public Administration | 0.20 |
| Agriculture, Forestry, Fishing and Hunting | 0.19 |
| Accommodation and Food Services | 0.19 |
The industries with the highest similarity score are the most representative of overall detection trends in our data. By contrast, industries with lower similarity scores may face unique threats, possibly because there are some specialized aspects of the IT infrastructure across the organizations in that industry. Ultimately, this analysis shows yet again that there is a great deal of similarity in technique prevalence across industries. Even at the low end of this list, where the similarity score is a seemingly low 0.19, it’s notable given there are 201 techniques and 424 sub-techniques in MITRE ATT&CK. Despite all those potential techniques, no industry top 10 was entirely unique.
The following are prevalence lists for industries with the highest volumes of detection across our data. Since we’ve discussed many of these techniques at length in this and previous reports, we won’t spend much time retreading why the most common of these techniques are prevalent. However, we’ll include some analytical notes beneath each industry list.
Professional, Scientific, and Technical Services
- T1059.001: PowerShell
- T1059.003: Windows Command Shell
- T1078.004: Cloud Accounts
- T1047: Windows Management Instrumentation
- T1218.011: Rundll32
- T1105: Ingress Tool Transfer
- T1027:Obfuscated Files or Information
- T1036.005: Match Legitimate Name or Location
- T1546.008: Accessibility Features
- T1055: Process Injection
For this umbrella category for organizations that perform professional, scientific, and technical activities on behalf of others, it’s difficult to assess why these techniques are prevalent in this industry for reasons that aren’t explained in the technique-specific sections of this and prior Threat Detection Reports.
Finance and Insurance
- T1059.001: PowerShell
- T1059.003: Windows Command Shell
- T1057: Process Discovery
- T1569.002: Service Execution
- T1027.006: HTML Smuggling
- T1021.003: Distributed Component Object Model
- T1036.003: Rename System Utility
- T1546.008: Accessibility Features
- T1003: OS Credential Dumping
- T1218.011: Rundll32
It’s difficult to assess why adversaries would leverage these techniques against finance and insurance companies in particular. However, it’s nonetheless interesting that this list includes techniques that don’t appear in many other industry top 10s, especially HTML Smuggling and Distributed Component Object Model. However, it could be the case that the relative security maturity of finance and insurance companies force adversaries to leverage specialized and evasive tradecraft in order to succeed in more restrictive environments.
Manufacturing
- T1059.003: Windows Command Shell
- T1059.001: PowerShell
- T1218.011: Rundll32
- T1036: Masquerading
- T1078.004: Cloud Accounts
- T1105: Ingress Tool Transfer
- T1091: Replication Through Removable Media
- T1071.001: Web Protocols
- T1218.007: Msiexec
- T1114.003: Email Forwarding Rule
The presence of Replication Through Removable Media might reflect manufacturing organizations’ continued operational reliance on air-gapped or pseudo-air-gapped physical infrastructure and legacy systems—including those in which users are still able to connect and use USB memory devices.
Information
- T1078.004: Cloud Accounts
- T1059.001: PowerShell
- T1027: Obfuscated Files or Information
- T1059.003: Windows Command Shell
- T1105: Ingress Tool Transfer
- T1047: Windows Management Instrumentation
- T1059.004: Unix Shell
- T1059.006: Python
- T1621: Multi-Factor Request Generation
- T1059.002: AppleScript
The prevalence of scripting techniques (Unix Shell, Python, AppleScript) alongside Cloud Accounts is likely a reflection of the sector’s relative technological diversity. As such, adversaries are forced to leverage operating system-specific techniques to accomplish their objectives in environments that may contain larger numbers of Linux and macOS systems.
Educational Services
- T1078.004: Cloud Accounts
- T1114.003: Email Forwarding Rule
- T1059.001: PowerShell
- T1564.008: Email Hiding Rules
- T1059.003: Windows Command Shell
- T1105: Ingress Tool Transfer
- T1027: Obfuscated Files or Information
- T1546.008: Email Hiding Rules
- T1505.003: Web Shell
- T1204.002: Malicious File
Email Forwarding Rule and Email Hiding Rules are probably on this list due to heavy reliance on email communications within educational institutions, which adversaries target to steal sensitive information. We wrote about one such campaign in a blog in the summer of 2023.
Health Care and Social Assistance
- T1059.001: PowerShell
- T1078.004: Cloud Accounts
- T1059.003: Windows Command Shell
- T1140: Deobfuscate/Decode Files or Information
- T1114.003: Email Forwarding Rule
- T1047: Windows Management Instrumentation
- T1059.004: Unix Shell
- T1053.003: Cron
- T1105: Ingress Tool Transfer
- T1059.005: Visual Basic
As was the case with the Information industry, the presence of Visual Basic and Unix Shell on this list are likely reflections of the varied systems and platforms used at hospitals and healthcare companies and the adversary desire to infiltrate those systems.
Threats by industry
Our analysis of industry targeting trends among prevalent threats revealed that there were few instances of meaningful trends. We assess that the vast majority of threats we detect are commodity threats that target organizations indiscriminately. Nonetheless, the following bullet list includes the insights we observed among prevalent threats throughout the year:
- Gamarue seemed to disproportionately target organizations in the manufacturing sector. This is likely because Gamarue is a worm that spreads via USB, suggesting that manufacturers may plausibly have more permissive policies around USB and removable media. This assertion is supported by the fact that T1091: Replication Through Removable Media is the seventh most prevalent technique among manufacturers.
- Raspberry Robin is also a worm that spreads via USB, and it also seems to disproportionately affect manufacturers, likely for the very same reasons as Gamarue.
- Yellow Cockatoo affected educational services disproportionately, and particularly the Colleges, Universities, and Professional Schools industry (the six-digit NAICS classification). Yellow Cockatoo leverages SEO poisoning to deliver payloads matching the user’s search query, so this trend makes sense given that users in educational services are frequently conducting open source research, often in permissive IT environments that may lack security controls that could block this activity.
- Gootloader also demonstrated an interesting targeting profile in that it disproportionately targeted organizations in the Legal Services industry group (a four-digit NAICS classification). Gootloader leverages SEO poisoning to draw its victims into malicious websites purporting to contain official documents, suggesting that lawyers and individuals at legal services companies leverage search engines to find and download legal documents.